Advanced MACD Dynamic Trend Quantitative Trading Strategy

Overview
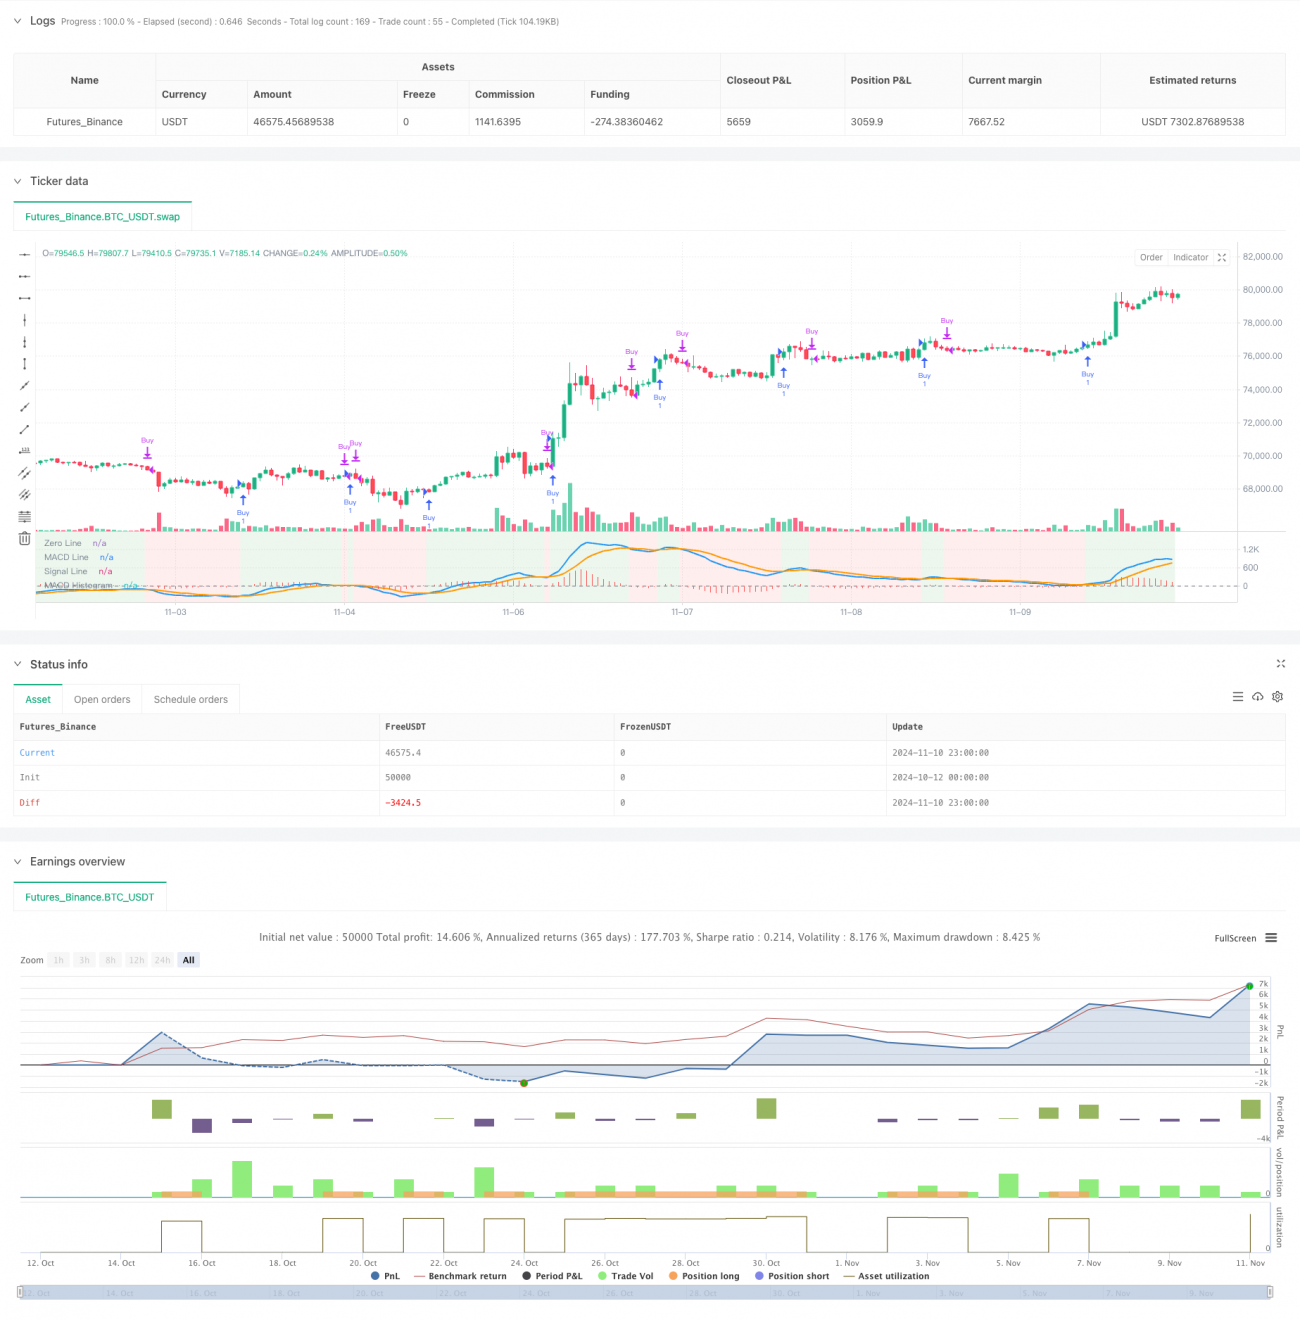
This strategy is an advanced quantitative trading system based on the Moving Average Convergence Divergence (MACD) indicator, enhancing trading decisions through dynamic background display and multiple preset parameter combinations. The core of the strategy lies in capturing market trend transition points through MACD crossover signals and visually displaying market conditions.
Strategy Principle
The strategy employs ten different MACD parameter presets, including Standard (12,26,9), Short-term (5,35,5), Long-term (19,39,9), etc., to adapt to different market environments and trading styles. The system generates buy signals when the MACD line crosses above the signal line (golden cross) and sell signals when it crosses below (death cross). The strategy enhances visual recognition through dynamic background color changes (green for bullish, red for bearish) to help traders better grasp market trends.
Strategy Advantages
- Parameter Flexibility: Offers ten preset parameter combinations for different market environments
- Clear Visual Feedback: Dynamic background color changes provide intuitive market trend display
- Clear Signals: Generates explicit buy/sell signals based on MACD crossovers
- High Adaptability: Applicable to different timeframe trading
- Clear Code Structure: Uses switch structure for parameter switching, easy to maintain and extend
Strategy Risks
- Lag Risk: MACD as a lagging indicator may generate delayed signals in volatile markets
- False Breakout Risk: May generate false crossover signals in ranging markets
- Parameter Dependency: Different parameter combinations perform differently in various market conditions
- Market Condition Limitations: May underperform in highly volatile or illiquid market environments
Strategy Optimization Directions
- Implement volatility filters to filter out trading signals during highly volatile periods
- Add trend confirmation indicators like RSI or ATR to improve signal reliability
- Implement adaptive parameter optimization based on market conditions
- Add stop-loss and take-profit functionality to enhance risk management
- Include volume analysis to improve signal reliability
Summary
This is a well-structured, logically sound advanced version of the MACD strategy. Through multiple parameter presets and dynamic visual feedback, it significantly enhances the strategy's practicality and operability. While inherent risks exist, the strategy has the potential to become a robust trading system with the suggested optimizations. Traders are advised to conduct thorough backtesting before live implementation and choose appropriate parameter settings based on specific market conditions.
- 1