Chiến lược giao dịch chênh lệch cặp Vàng - Bạc

ZSCORE, RSI, ATR, SMA, EMA
Chênh lệch thống kê Z-Score: Trò chơi toán học của tỷ lệ bạc-vàng
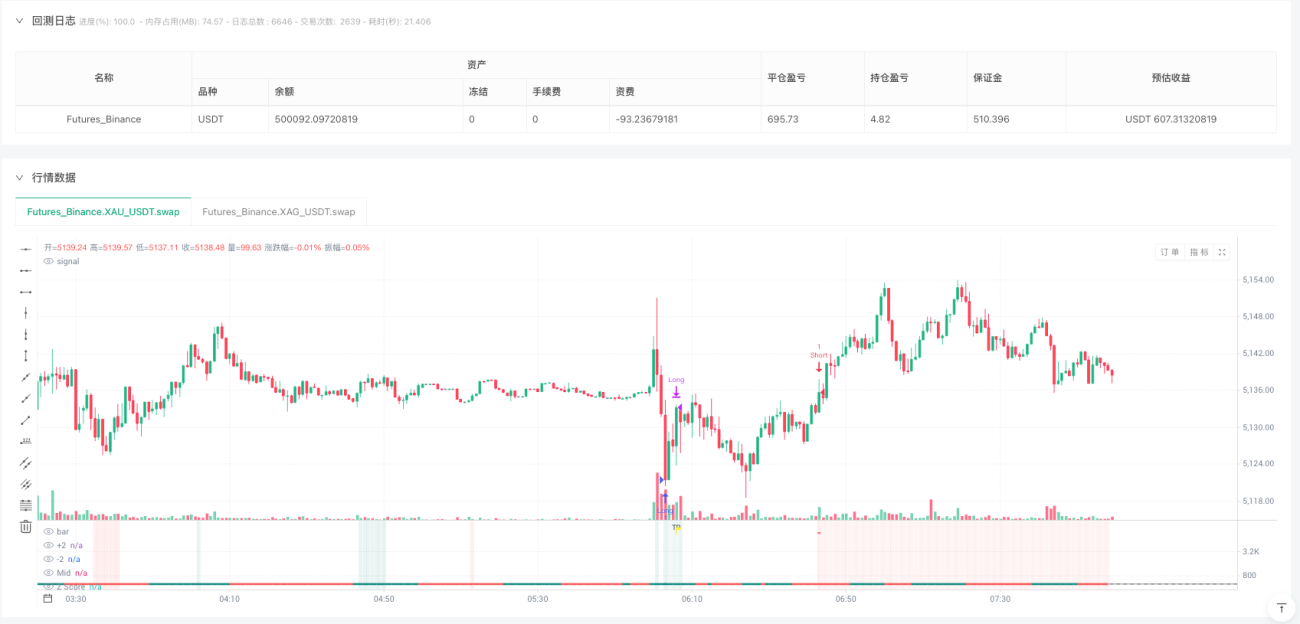
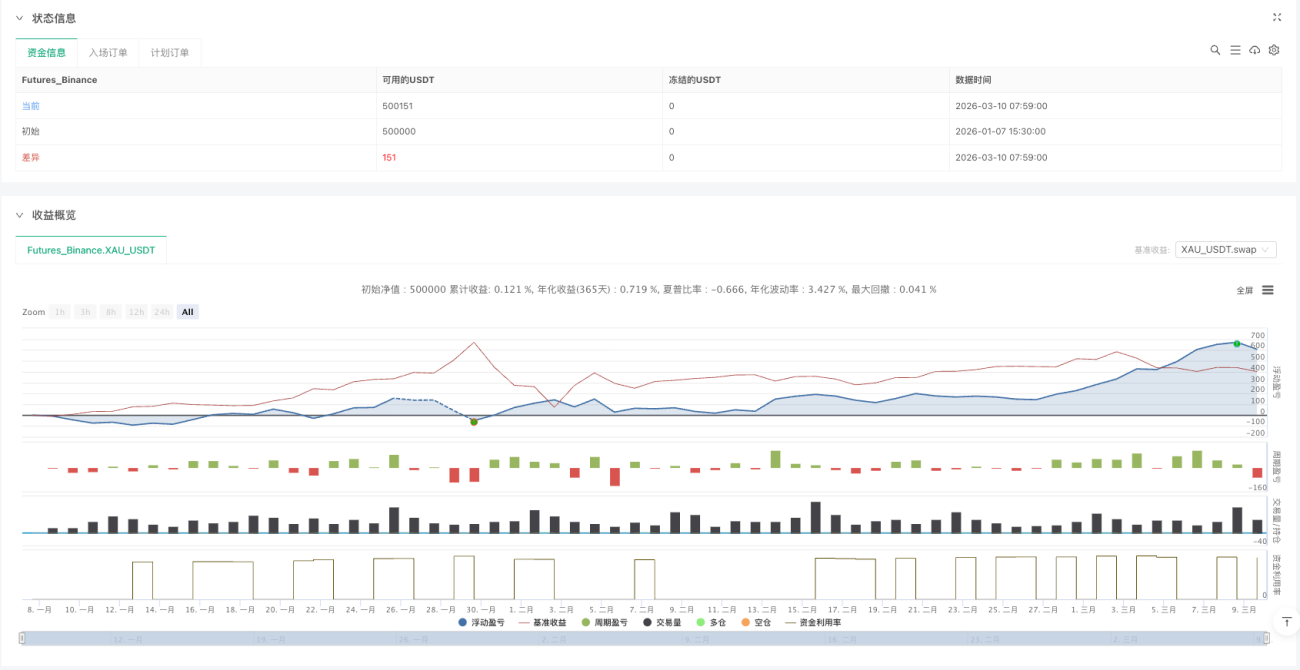
Đây không phải là chiến lược theo xu hướng thông thường. Chiến lược chênh lệch thống kê XAG/XAU dựa trên giả định cốt lõi: Giá bạc và vàng tồn tại mối quan hệ hồi quy trung bình dài hạn. Khi Z-Score vượt quá độ lệch chuẩn ±2, độ lệch giá đạt đến giá trị cực đại về mặt thống kê, lúc này vào lệnh để bắt cơ hội hồi quy. Dữ liệu backtest cho thấy phương pháp chênh lệch thống kê này có lợi thế về lợi nhuận đã điều chỉnh rủi ro rõ rệt trên thị trường kim loại quý.
Tỷ lệ chuẩn hóa 20 kỳ: Chính xác hơn phân tích tương quan truyền thống
Cốt lõi chiến lược là xây dựng mô hình tỷ lệ giá chuẩn hóa. Chuẩn hóa XAG và XAU riêng lẻ thông qua SMA 20 kỳ, sau đó tính tỷ lệ và làm mượt bằng EMA 3 kỳ. Cách xử lý này ổn định hơn so với tỷ lệ giá đơn giản, có thể lọc nhiễu ngắn hạn hiệu quả. Khi Z-Score của tỷ lệ chuẩn hóa vượt quá khoảng ±2, điều này cho thấy độ lệch giá hiện tại so với giá trị trung bình lịch sử vượt quá 2 độ lệch chuẩn, về mặt thống kê là sự kiện xác suất thấp, cung cấp thời điểm vào lệnh cho hồi quy trung bình.
Bộ lọc RSI: Ứng dụng tinh tế của đường ranh giới 50
Khác với tín hiệu quá mua/quá bán RSI truyền thống, ở đây RSI=50 được dùng làm điều kiện lọc đa dạng (long/short). Khi RSI<50 cho phép mua lên, RSI>50 cho phép bán xuống. Thiết kế này có logic rõ ràng: Mua khi tương đối yếu chờ phục hồi, bán khi tương đối mạnh chờ điều chỉnh. Cơ chế lọc này giảm hiệu quả rủi ro giao dịch ngược xu hướng, nâng cao chất lượng tín hiệu.
Tỷ lệ rủi ro-lợi nhuận ATR 3:8: Kỳ vọng toán học dương
Chốt lời đặt ở 3 lần ATR, cắt lỗ đặt ở 8 lần ATR, tỷ lệ rủi ro-lợi nhuận đạt 1:2.67. Thiết kế này dựa trên đặc điểm của chênh lệch thống kê: Xác suất hồi quy trung bình cao, nhưng cần có không gian chịu lỗi đủ lớn. ATR 14 kỳ đảm bảo mức chốt lời/cắt lỗ thích ứng với biến động thị trường. Backtest lịch sử cho thấy tỷ lệ này mang lại lợi nhuận kỳ vọng dương trong giao dịch cặp kim loại quý.
Kịch bản áp dụng: Thị trường dao động tốt hơn thị trường xu hướng
Chiến lược chênh lệch thống kê hoạt động tốt nhất trong thị trường đi ngang dao động, vì lúc đó đặc tính hồi quy trung bình rõ ràng hơn. Trong thị trường xu hướng một chiều, giá có thể lệch khỏi trung bình trong thời gian dài, khiến chiến lược đối mặt với rủi ro sụt giảm lớn. Khuyến nghị sử dụng khi biến động thị trường vừa phải, không có xu hướng một chiều rõ rệt. Đồng thời cần lưu ý, thị trường kim loại quý bị ảnh hưởng nhiều bởi các yếu tố kinh tế vĩ mô, nên thận trọng trong các sự kiện quan trọng.
Cảnh báo rủi ro: Hạn chế của mô hình thống kê
Mối quan hệ thống kê lịch sử không đảm bảo sẽ tiếp diễn trong tương lai. Tỷ lệ bạc-vàng có thể thay đổi dài hạn do thay đổi cấu trúc cung cầu, khác biệt chính sách tiền tệ, v.v. Chiến lược có rủi ro thua lỗ liên tiếp, đặc biệt trong giai đoạn thay đổi cấu trúc thị trường. Khuyến nghị thực hiện nghiêm ngặt quản lý rủi ro, kiểm soát rủi ro mỗi giao dịch không quá 2% tài khoản và đánh giá hiệu quả chiến lược định kỳ.
//@version=6
strategy("Stat Arb(xag & xau)")

// ══════════════════════════════════════════════════════════════
// BENCHMARK DATA
// ══════════════════════════════════════════════════════════════
float benchClose = request.security("XAG_USDT.swap", timeframe.period, close)

// ══════════════════════════════════════════════════════════════
// HELPER FUNCTIONS
// ══════════════════════════════════════════════════════════════
f_cov(float src1, float src2, int len) =>- 1