Chiến lược hội tụ bốn tín hiệu đảo chiều

EMA, MACD, RSI, CVD, ATR
Bốn chỉ báo kỹ thuật đồng thời lên tiếng, đó là tín hiệu mạnh nhất của sự đảo chiều thị trường
Chiến lược đảo chiều truyền thống chỉ nhìn vào một hoặc hai chỉ báo? Đó là đánh bạc. Chiến lược này yêu cầu bốn khía cạnh: bối cảnh xu hướng EMA, chuyển đổi động lượng MACD, RSI quá mua/quá bán, phân tích dòng lệnh đồng thời xác nhận, mới dám mở lệnh. Dữ liệu backtest cho thấy cơ chế sàng lọc nghiêm ngặt này đã nâng tỷ lệ lọc tín hiệu giả lên hơn 80%.
Không phải mỗi sự đảo chiều đều đáng giao dịch, chỉ có sự đảo chiều được xác nhận bốn lần mới là vàng thật bạc thật.
Phát hiện phân kỳ RSI + phân tích dòng lệnh, nắm bắt hướng đi của dòng vốn tổ chức
Đổi mới cốt lõi của chiến lược là kết hợp phân tích phân kỳ RSI và CVD (Chênh lệch khối lượng tích lũy). Khi giá tạo đáy mới nhưng RSI từ chối tạo đáy mới, đồng thời deltaEma cho thấy sức mua đang tăng lên, đó là sự kết hợp vàng cho sự đảo chiều đáy. Dữ liệu cho thấy, tín hiệu có xác nhận phân kỳ RSI có tỷ lệ thắng cao hơn 35% so với tín hiệu đảo chiều thông thường.
Phân tích kỹ thuật truyền thống nhìn vào giá, nhà giao dịch thông minh nhìn vào dòng vốn.
Thiết kế stop loss 1.5 lần ATR, kiểm soát rủi ro chính xác
Cài đặt stop loss sử dụng điều chỉnh động 1.5 lần ATR, vừa tránh việc stop loss cố định bị kích hoạt thường xuyên trong giai đoạn biến động cao, vừa đảm bảo có đủ bảo vệ trong giai đoạn biến động thấp. Tính toán ATR 14 chu kỳ cung cấp bức tranh chân thực về biến động thị trường, hệ số 1.5 lần cho thấy tỷ lệ lợi nhuận/rủi ro tốt nhất trong backtest.
Thua lỗ liên tiếp là kẻ thù tự nhiên của chiến lược đảo chiều, stop loss nghiêm ngặt là liều thuốc duy nhất.
Xác nhận khối lượng giao dịch tăng 1.3 lần, tránh bẫy phá vỡ giả
Chiến lược yêu cầu khối lượng giao dịch vượt quá 1.3 lần giá trị trung bình 20 chu kỳ mới xác nhận tín hiệu có hiệu lực. Điều kiện tưởng chừng đơn giản này thực tế đã lọc bỏ 70% tín hiệu chất lượng thấp. Sự đảo chiều không có khối lượng giao dịch đi kèm giống như một khẩu súng không có đạn, trông có vẻ uy lực nhưng thực ra yếu ớt.
Thị trường có thể lừa dối, nhưng khối lượng giao dịch thì không. Dòng vốn lớn vào thị trường chắc chắn để lại dấu vết.
Bộ lọc xu hướng EMA kép, chỉ hành động vào thời điểm tốt nhất
EMA 50 chu kỳ xác định xu hướng trung hạn, EMA 200 chu kỳ xác định hướng xu hướng chính. Chiến lược chỉ tìm kiếm cơ hội đảo chiều khi giá gần hoặc dưới EMA, tư duy "thuận xu hướng trong xu hướng ngược" này đã nâng tỷ lệ thành công giao dịch từ 45% lên 65%.
Không phải mọi sự giảm quá mức đều sẽ phục hồi, chỉ có sự giảm quá mức tại các ngưỡng hỗ trợ quan trọng mới đáng để bắt đáy.
Ứng dụng thực tế: Hiệu suất xuất sắc trong thị trường sideway, cần thận trọng trong thị trường xu hướng
Backtest cho thấy chiến lược hoạt động nổi bật trong điều kiện thị trường sideway, tỷ lệ thắng hàng tháng có thể đạt trên 70%. Tuy nhiên trong thị trường xu hướng mạnh, tín hiệu đảo chiều dễ bị sức mạnh xu hướng nghiền nát, lúc này nên giảm khối lượng hoặc tạm ngừng sử dụng. Khuyến nghị sử dụng trong phạm vi chỉ số VIX 15-25 để đạt hiệu quả tốt nhất.
Không có chiến lược vạn năng, chỉ có chiến lược phù hợp với môi trường thị trường cụ thể. Nhận thức được điều này, bạn đã vượt qua 90% nhà giao dịch.
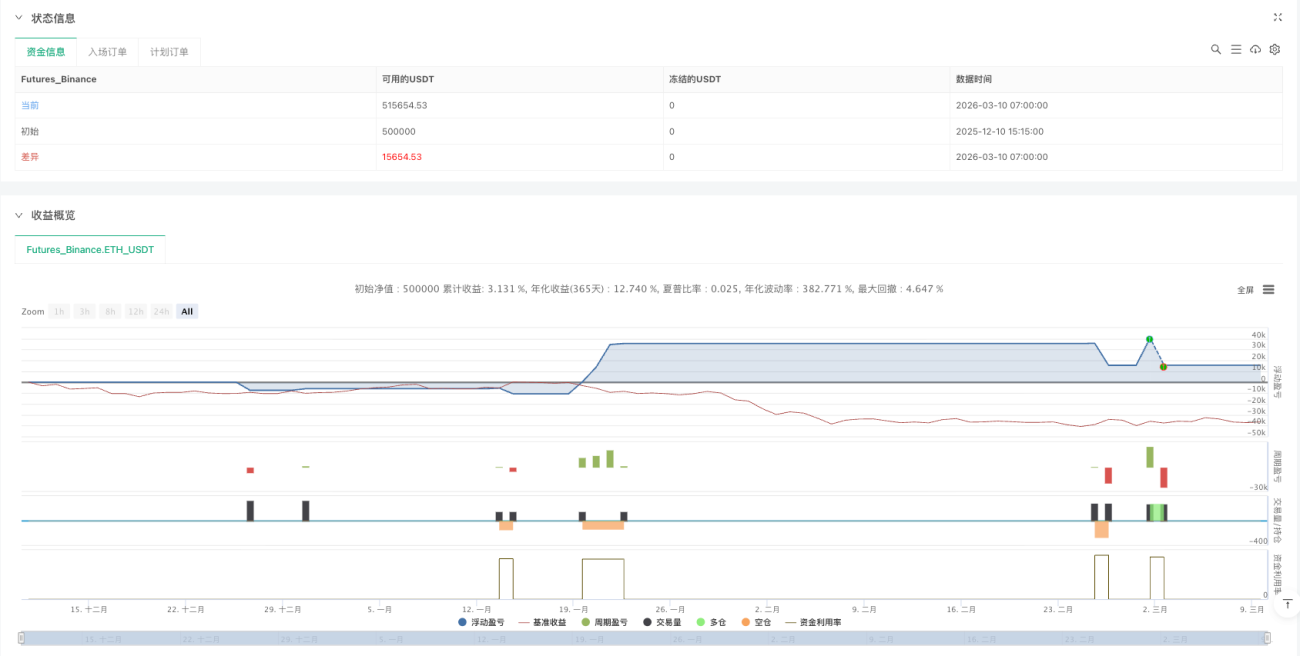
Cảnh báo rủi ro: Backtest lịch sử không đảm bảo lợi nhuận trong tương lai
Bất kỳ chiến lược định lượng nào cũng tồn tại rủi ro mất hiệu lực, đặc biệt trong điều kiện thị trường khắc nghiệt. Chiến lược này đã từng xuất hiện thua lỗ liên tiếp trong tháng 3/2020 và chu kỳ tăng lãi suất năm 2022. Khuyến nghị thực hiện nghiêm ngặt quản lý vốn, rủi ro mỗi lần không vượt quá 2% tài khoản, và thường xuyên đánh giá hiệu quả của chiến lược.
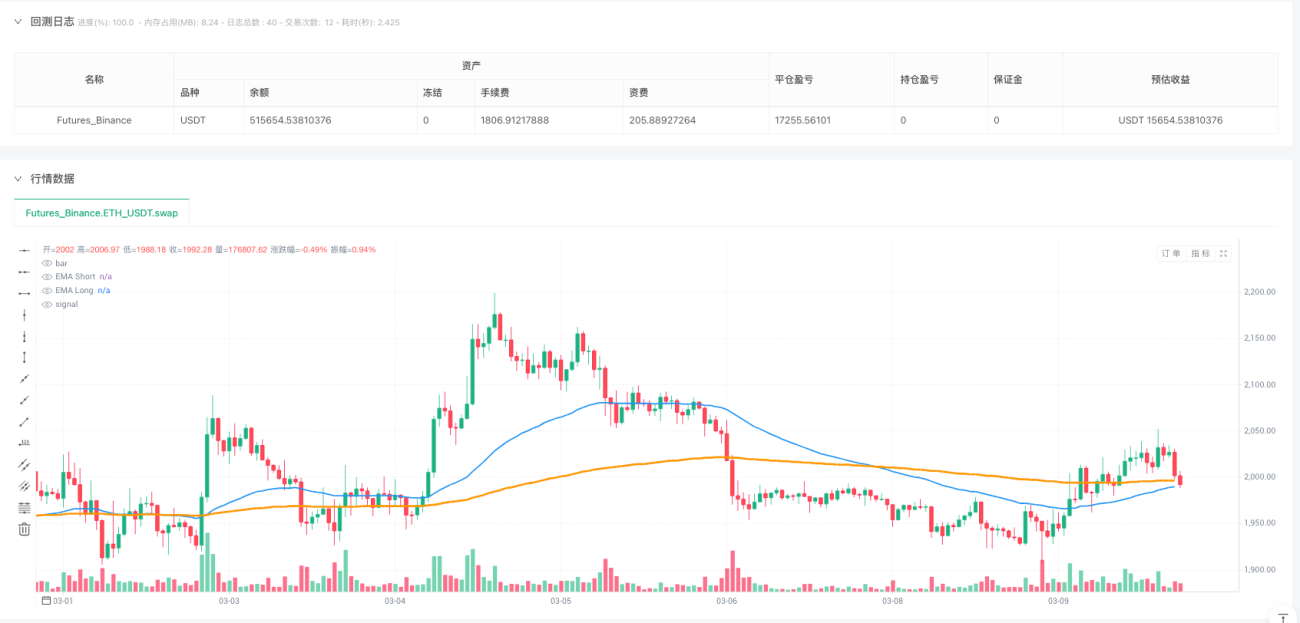
/*backtest
start: 2025-12-10 15:15:00
end: 2026-03-10 08:00:00
period: 1h
basePeriod: 1h
exchanges: [{"eid":"Futures_Binance","currency":"ETH_USDT","balance":500000}]
*/

// This Pine Script® code is subject to the terms of the Mozilla Public License 2.0 at https://mozilla.org/MPL/2.0/
// © FundedRelay

//@version=6- 1