MAGIC MACD

Thanks & Credits
To Tradingview Team for allowing me to use their default MACD version and coding it in to a MAGIC MACD by adding a few lines of code that
makes it more enhanced.
About:
MAGIC MACD ( MACD Indicator with Trend Filter and EMA Crossover confirmation and Momentum). This MACD uses Default Trading view MACD
from Technical indicators library and adding a second MACD along with 3 EMA's to detect Trend and confirm MACD Signal.
Eliminates usage of 3different indicators (Default MACD , MACD-2,EMA5, EMA20, EMA50)
Basic IDEA.
Idea is to filter Histogram when price is above or below 50EMA. Similar to QQE -mod oscillator but Has a EMA Filter
1.Take DEFAULT MACD crossover signals with lower period
2.check with a Higher MACD Histogram.
3.Enter upon EMA crossover signal and Histogram confirmation.
Histogram changes to GRAY when price is below EMA 50 or above EMA 50 (Follows Trend)
4.Exit on next Default MACD crossover signal.
Overview :
Moving Average Convergence Divergence Indicator Popularly Known as MACD is widely used. MACD Usually generates a lots of False signals
and noise in Lower Time Frames, making it difficult to enter a trade in sideways market. Divergence is a major issue along with sideways
movement and tangling of MACD and Signal Lines. There is no way to confirm a Default MACD signal, except to switch time frames and
verify.
Magic MACD Can be used to in combination with other signals.
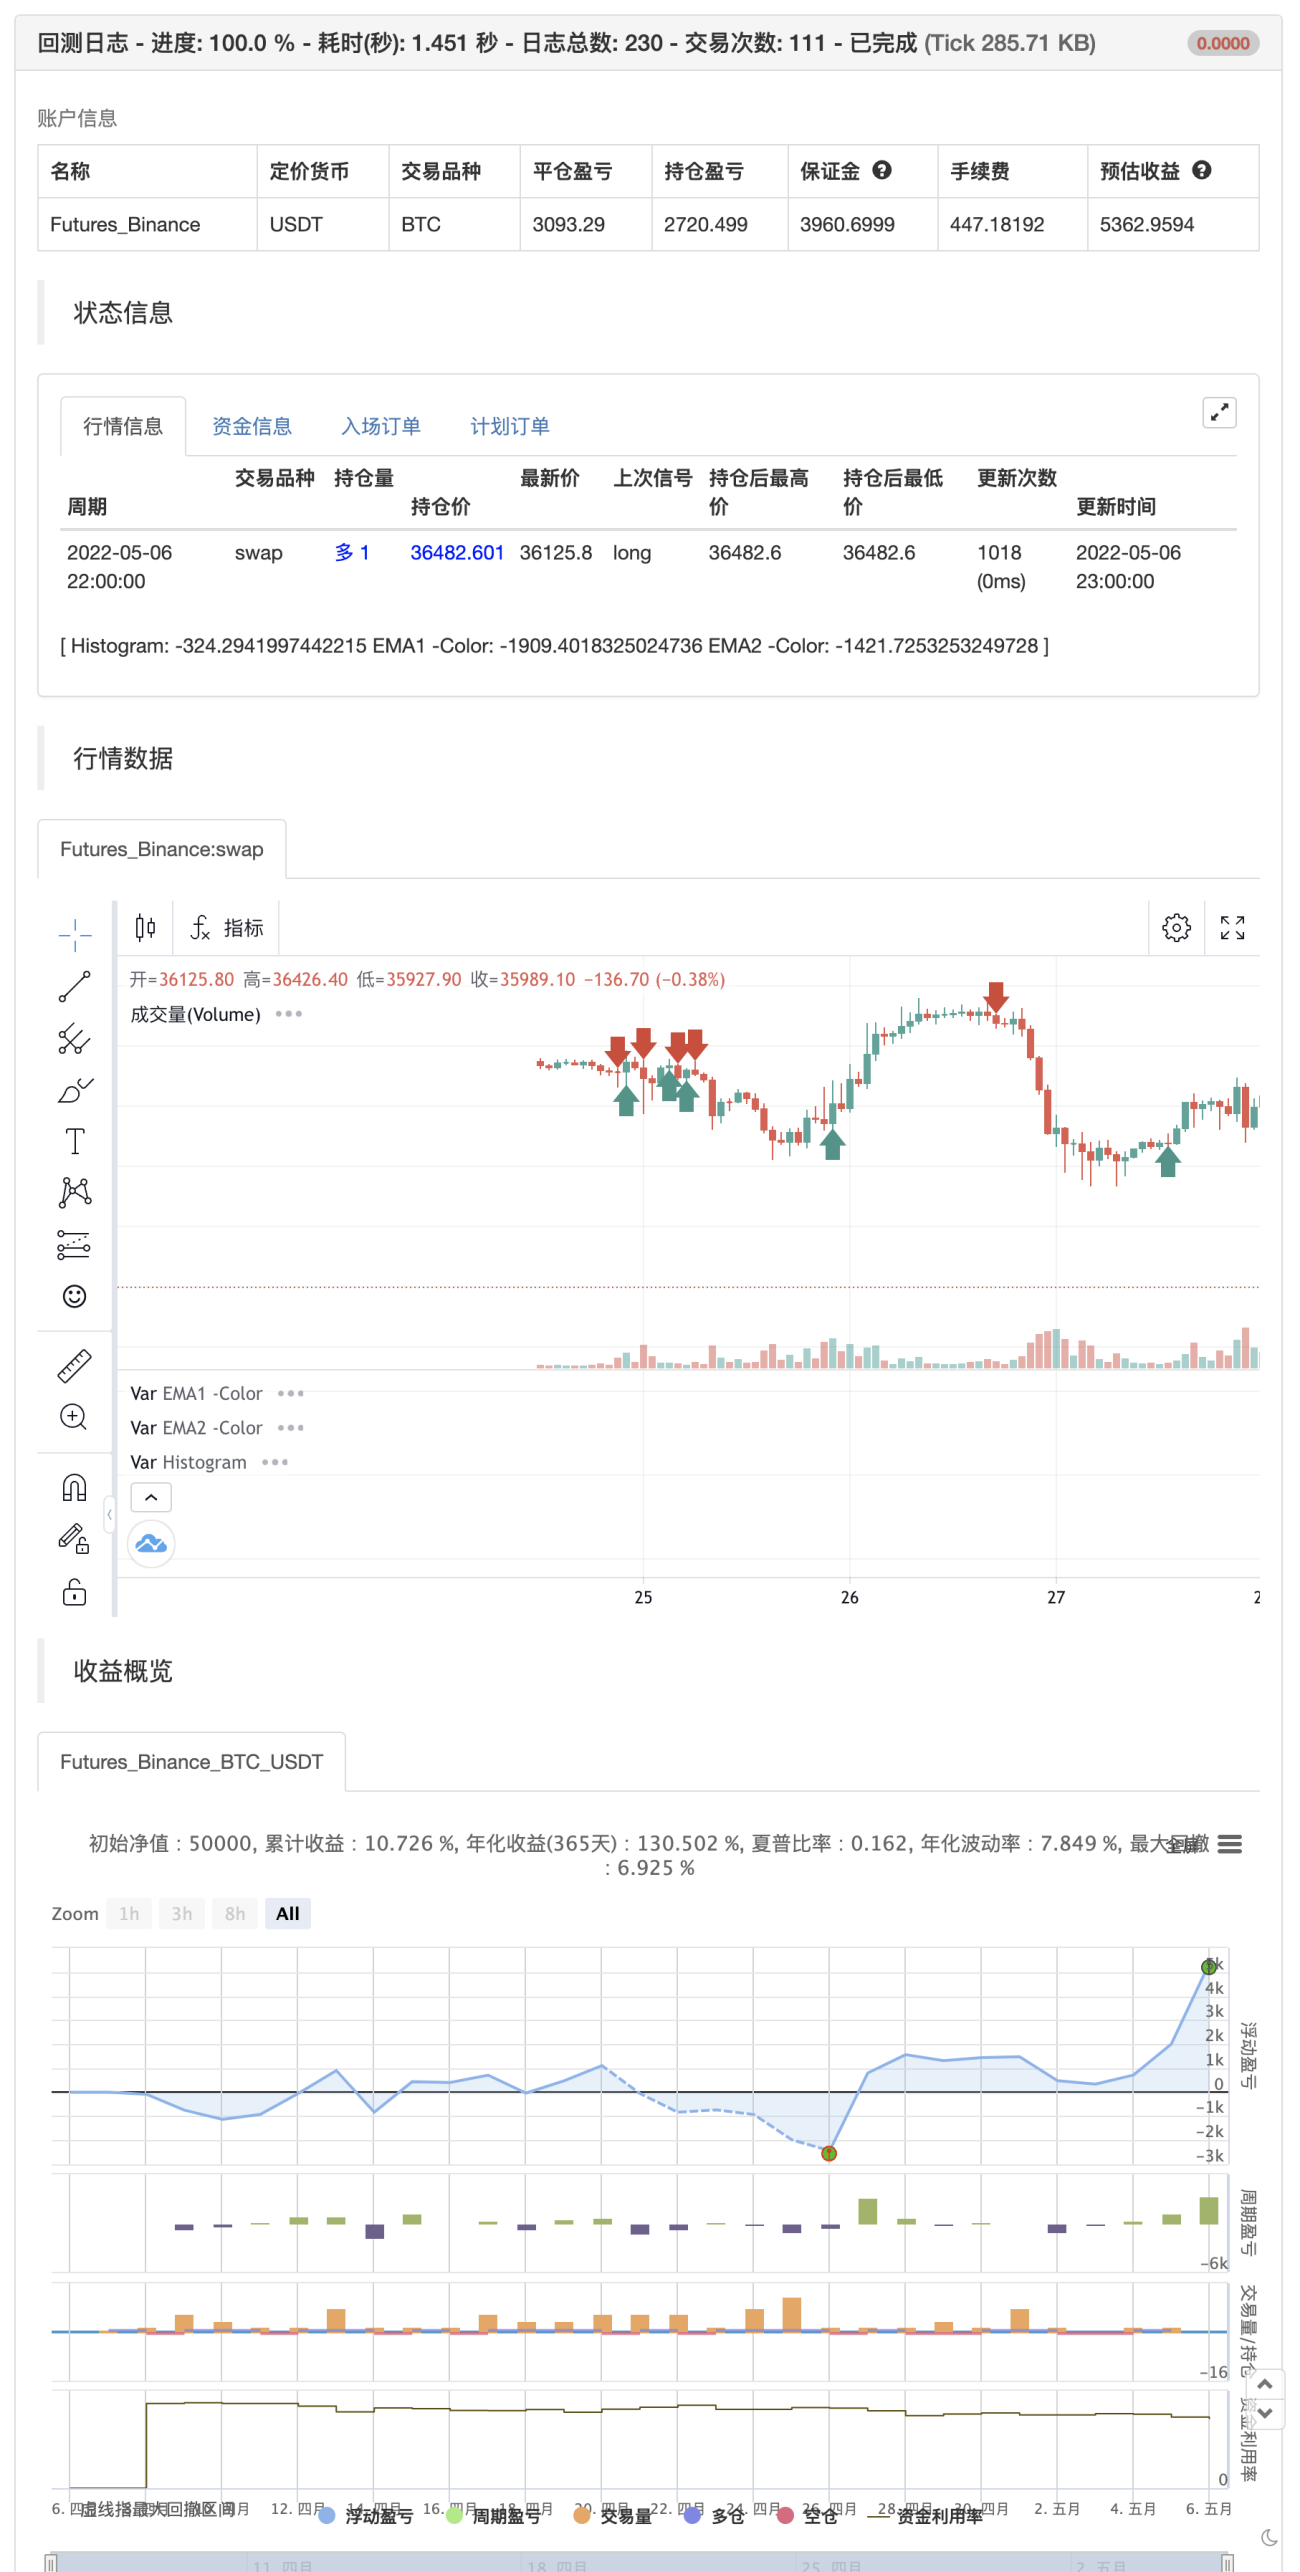
This MACD uses two MACD Signals to verify the signal given by Default MACD . The Histogram Plot shown is of a higher period
MACD (close,5,50,30) values. When a signal is generated on a lower MACD it is verified by the histogram with higher time period.
Technicals Used:
- Lower MACD-1 values 12,26 and signal-9 (crossover Signals)
- Higher MACD-2 values 5,50 and signal-30 (Histogram)
- EMA 50 (Histogram Filter to allow only if price above or below Ema 50)
- EMA 5 and EMA 20 for crossover confirmation of trend
What's is in this Indicator?
1.Histogram-(higher period 5,50 and 30signal)
2. MACD crossover Signals-(lower period Default MACD setting)
3.Signal Lines-( EMA 5 & 20)
Implemented & Removed in this Indicator
- Default MACD and Signal Lines are removed completely
- MACD crossover are taken on lower periods and plotted as signals(Blue Triangle or Red Triangle)
- Histogram is plotted from a higher Period providing a clear picture with Higher Time period
- EMA 5 and EMA 20 are used for MACD signal confirmation
How to use?
Up Signal
- MACD Default (12,26,30) up signals are shown in Blue
- Wait till the Histogram changes Blue
- Look for EMA signals crossover near by
Down Signal
- MACD Default (12,26,30) up signals are shown in Red
- Wait till the Histogram changes Red
- Look for EMA signals crossover near by
Do's
Consider only opposite color as signals
- Red Triangle on Blue Histogram(likely to move down direction)
- Blue Triangle on Red Histogram (Likely to move up direction)
Don'ts
1.Ignore Blue Signal on Blue Histogram (pull back signals can be used to enter trade if you miss first crossover)
2.Ignore Red Signal on Red Histogram(pull back signals can be used to enter trade if you miss first crossover)
3.Ignore Up and Down signals till Gray or Blacked out area is finished in Histogram
Tips:
- EMA plot also shows pull back areas along with signals
2.side by side opposite signals shows sides ways movement - EMA 5,20 is plotted on MACD Histogram for Additional Benefit
Warning...!
This is purely for Educational purpose only. Not to be used as a stand alone indicator. Usage is at your own Risk. Please get familiar with its working before implementing. Its not a Financial Advice or Suggestion . Any losses or gains is at your own risk.
backtest
- 1