Tom DeMark Sequential Heat Map

This indicator uses Tom DeMark’s TD Sequential counting from 1 to 13.
Number 9 and 13 usually identify an exhausted trend and mark a trend reversal.
The important numbers get displayed as labels (7-13), where 9 and 13 are both highlighted as "Long" or "Short".
Besides the numbers the price candles are colored based upon the sequence.
Bullish colors are starting from bright yellow ( TD 1 = start of trend) to dark red ( TD 13 = trend exhausted)
Bearish colors are starting from bright blue ( TD 1 = start of trend) to dark blue ( TD 13 = trend exhausted)
DeMark recommends to be used for short term price reversals only but as you can see in the chart, it also works for LUNA 1D chart.
Also works very well with Heikin Ashi candles.
Use it in combination with for example the "Tom DeMark Pressure Ratio" to find tops and bottoms.
You can change the timeframes, disable labels/barcolor and customise colors to your liking.
If you have any idea on how to optimise the code, please feel free to share
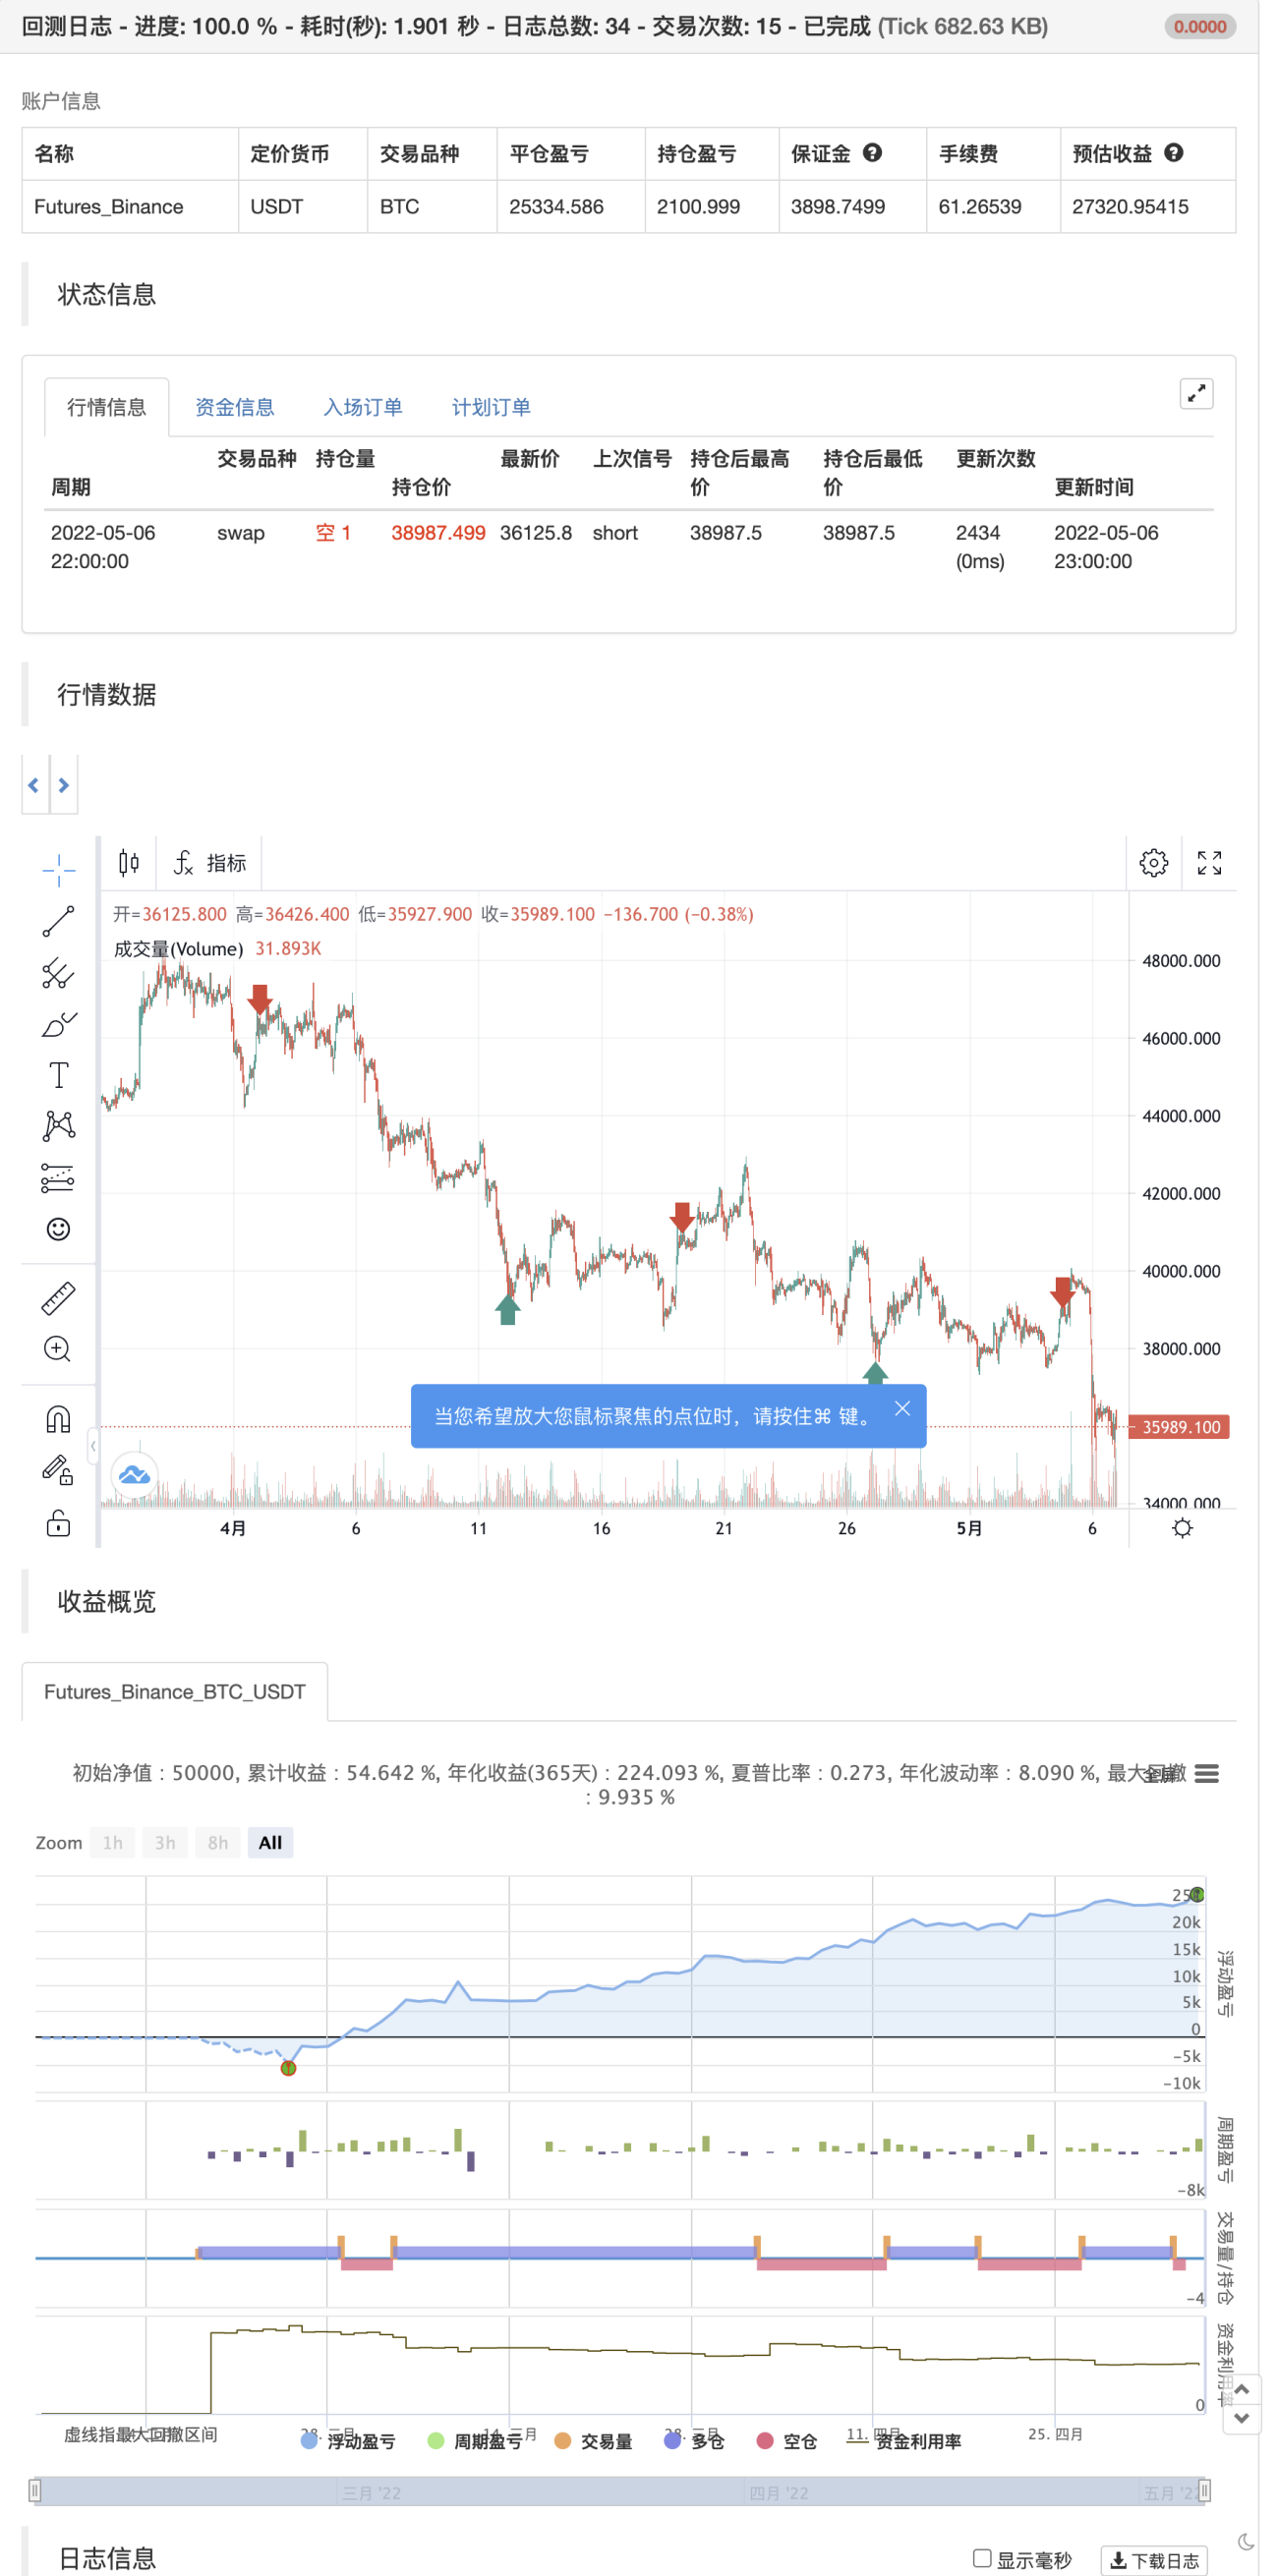
backtest
////////////////////////////////////////// Tom DeMark heatmap © by Indicator-Jones /////////////////////////////////////////
//
// This indicator uses Tom DeMark’s TD Sequential counting from 1 to 13.
// Number 9 and 13 usually identify an exhausted trend and mark trend reversal.
// The important numbers get displayed as labels (7-13), where 9 and 13 are both highlighted as "Long" or "Short".
// Besides the numbers the price candles are colored based upon the sequence.
// Bullish colors are starting from bright yellow (TD 1 = start of trend) to dark red (TD 13 = trend exhausted)
// Bearish colors are starting from bright blue (TD 1 = start of trend) to dark blue (TD 13 = trend exhausted)
//
// DeMark recommends to be used for short term price reversals only but as you can see in the chart, it also works for LUNA 1D chart.
// Also works very well with Heikin Ashi candles.
// Use it in combination with for example the "Tom DeMark Pressure Ratio" to find tops and bottoms.- 1