RSI and BBand simultaneously OverSold

This indicator is created by combining the standard period RSI indicator with an Oversold limit of 32, an Overbought limit of 70 and a period of 14 (these values can be changed optionally from the entries and still tabs of the indicator settings) and the Bollinger Band . indicator with a standard deviation of 2 and a period of 20. Also, the RSI Oversold is an upward green triangle where the price simultaneously falls below the BB and the lower limit (Low) (i.e. below 32), where the RSI Overbought (i.e. above 70) at the same time the price rises above the BB and the upper limit (Upper) is a downward red triangle. is indicated by a triangle. An alarm condition is established on these conditions. Source codes are posted visually and written in clear language and with explanations for beginners to learn to pine.
backtest
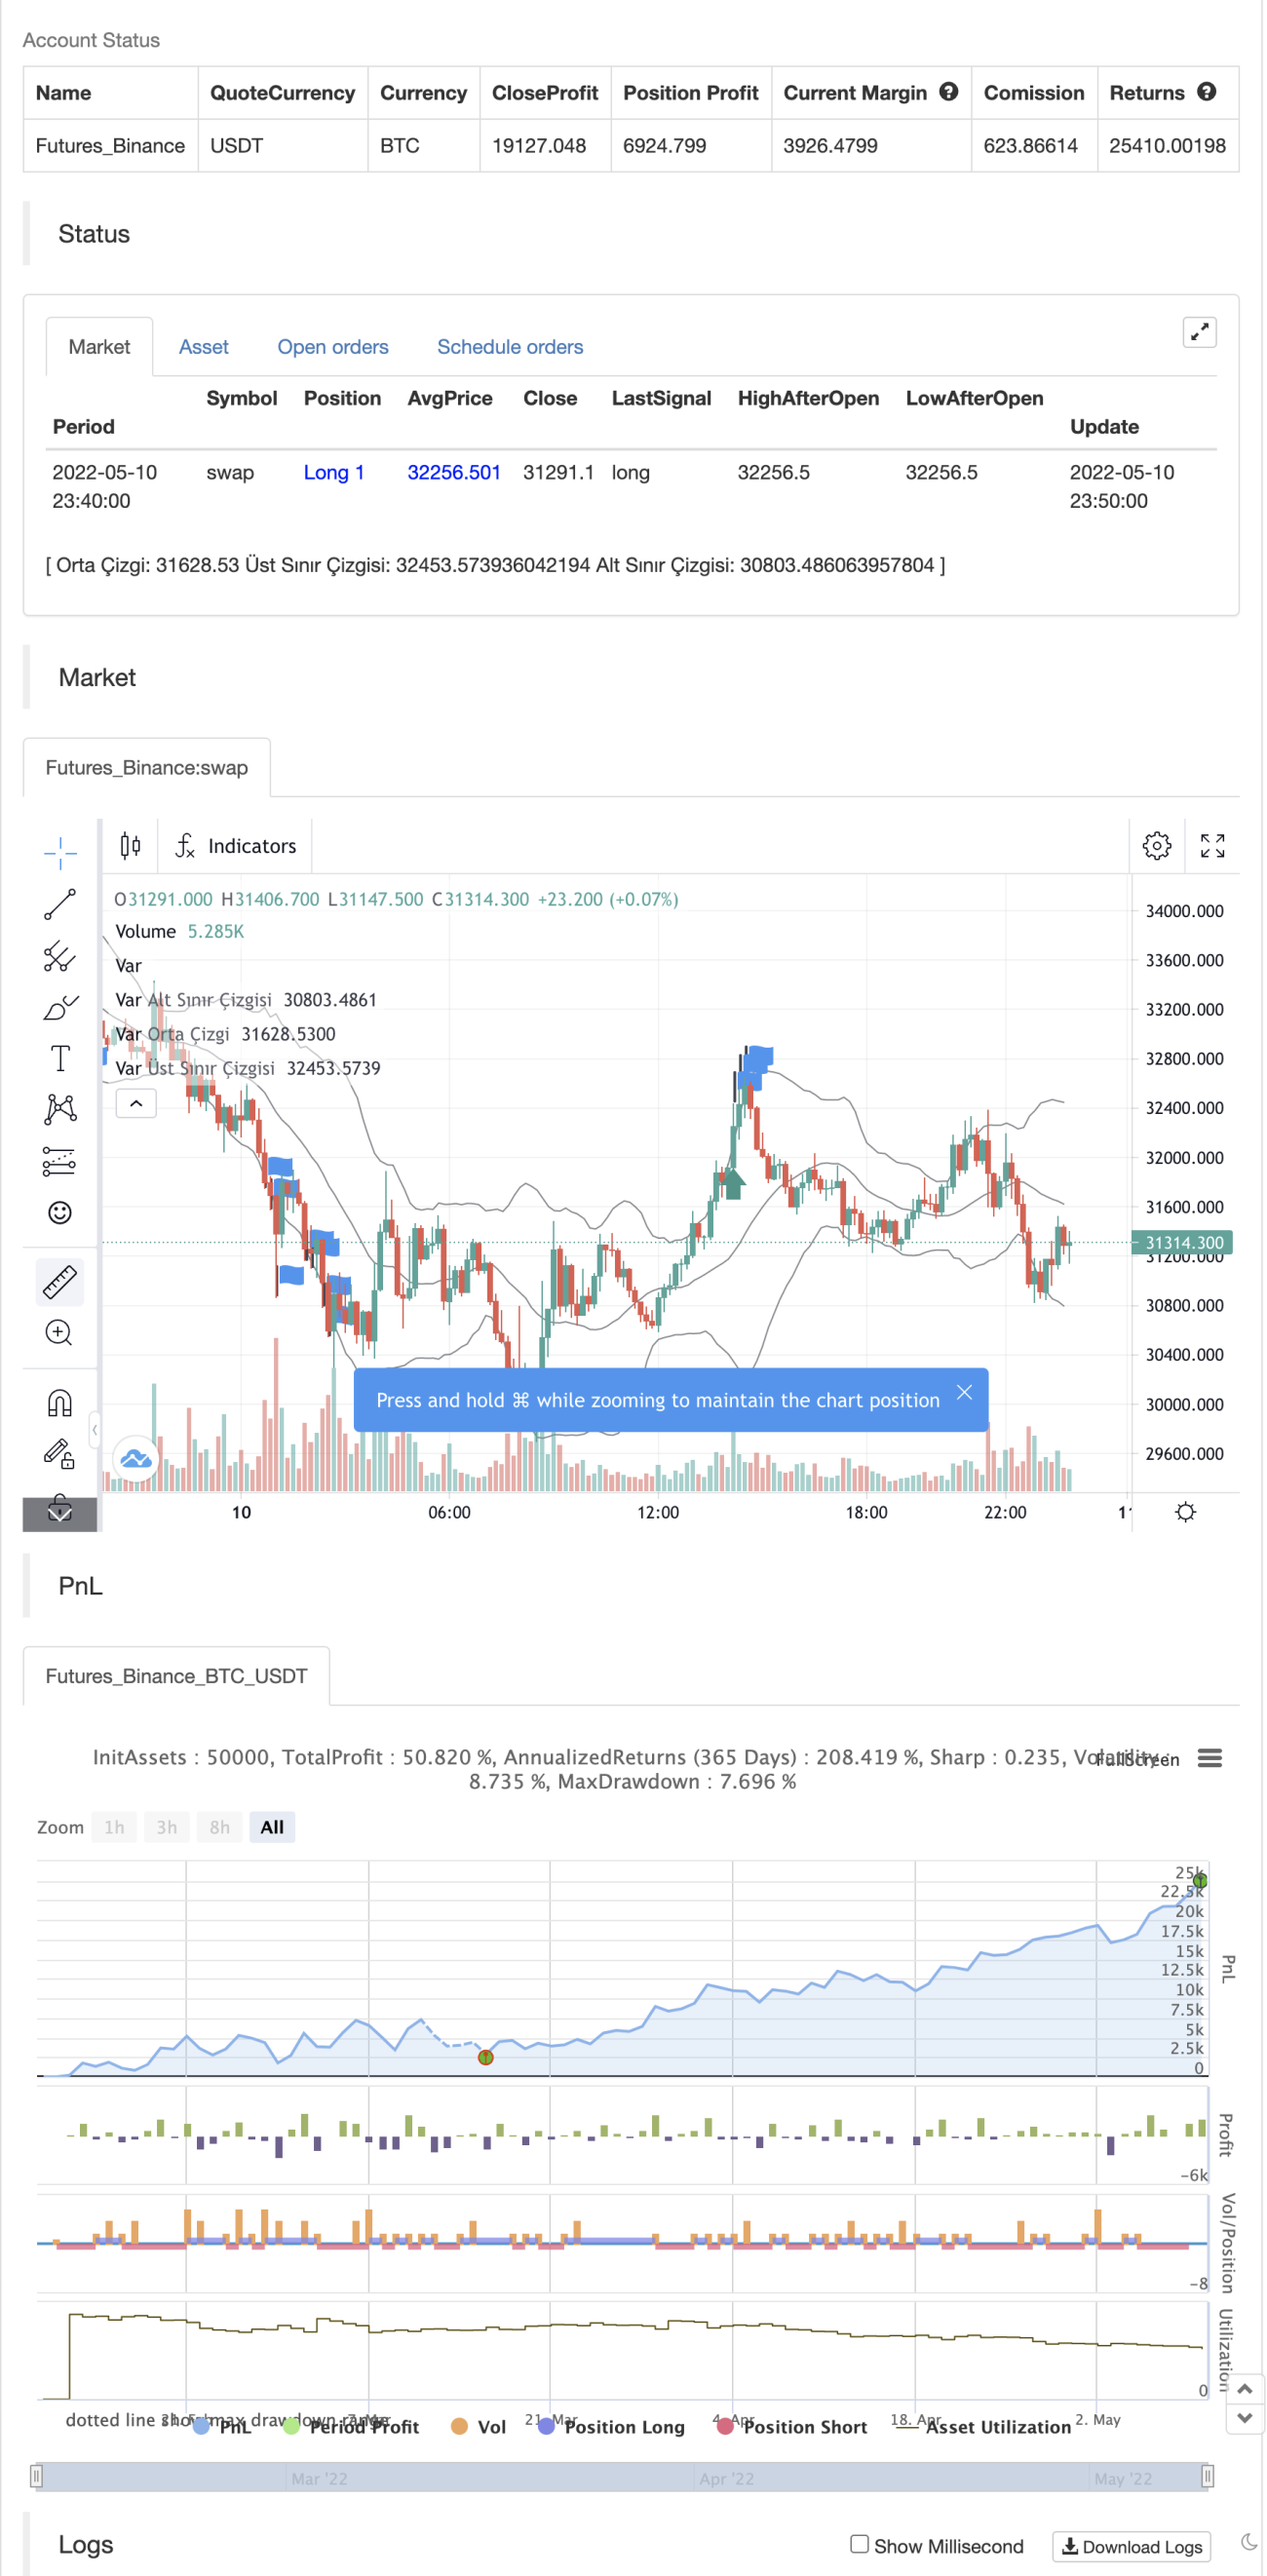
- 1