HALFTREND + HEMA + SMA (FALSE SIGNAL's STRATEGY)

=== INTRO and CREDITS ===
This script is a mix of 3 indicators in order to recreate FALSE SIGNAL's strategy from YouTube.
First indicator is a SMA ( Simple Moving Average ).
Second is the Hull Estimate (HEMA), which was developed by alexgrover.
And third is the Halftrend, by Alex Orekhov (everget).
Credit for each indicator belongs to them, i just modified those and the SMA to make FALSE SIGNAL's strategy with some extra options, settings, etc, also updated all the code to PineScript 5.
=== THE STRATEGY ===
Default settings are already as FALSE SIGNAL's requires so you don't have to change anything.
FOR LONGS (green background shows LONG entries).
- HEMA must be above the SMA .
- The body of the candle must be completely above the HEMA (wick can touch the HEMA, but there's an option to enable/disable this filter).
- Halftrend must trigger a BUY arrow (aqua color looking upwards).
FOR SHORTS (redbackground shows SHORT entries).
- HEMA* must be below the SMA .
- The body of the candle must be completely below the HEMA (wick can touch the HEMA, but there's an option to enable/disable this filter).
- Halftrend must trigger a SELL arrow (orange color looking downwards).
*FALSE SIGNAL suggests to change HEMA period to 40 for shorts instead of 50.
Please check FALSE SIGNAL's YouTube channel for more info.
=== GENERAL IMPROVEMENTS ===
Upgrade to PineScript 5.
Some performance improvements.
SMA takes GREEN color when only LONGs should be taken, RED color for SHORTs.
HEMA take AQUA color when only LONGs should be taken, ORANGE color for SHORTs.
=== PERSONAL NOTES ===
High timeframes (1h+) can take long time to trigger entries, be patient or use lower timeframes.
Thanks again to the authors of the indicators that compose this script and to FALSE SINGAL to create this strategy.
backtest
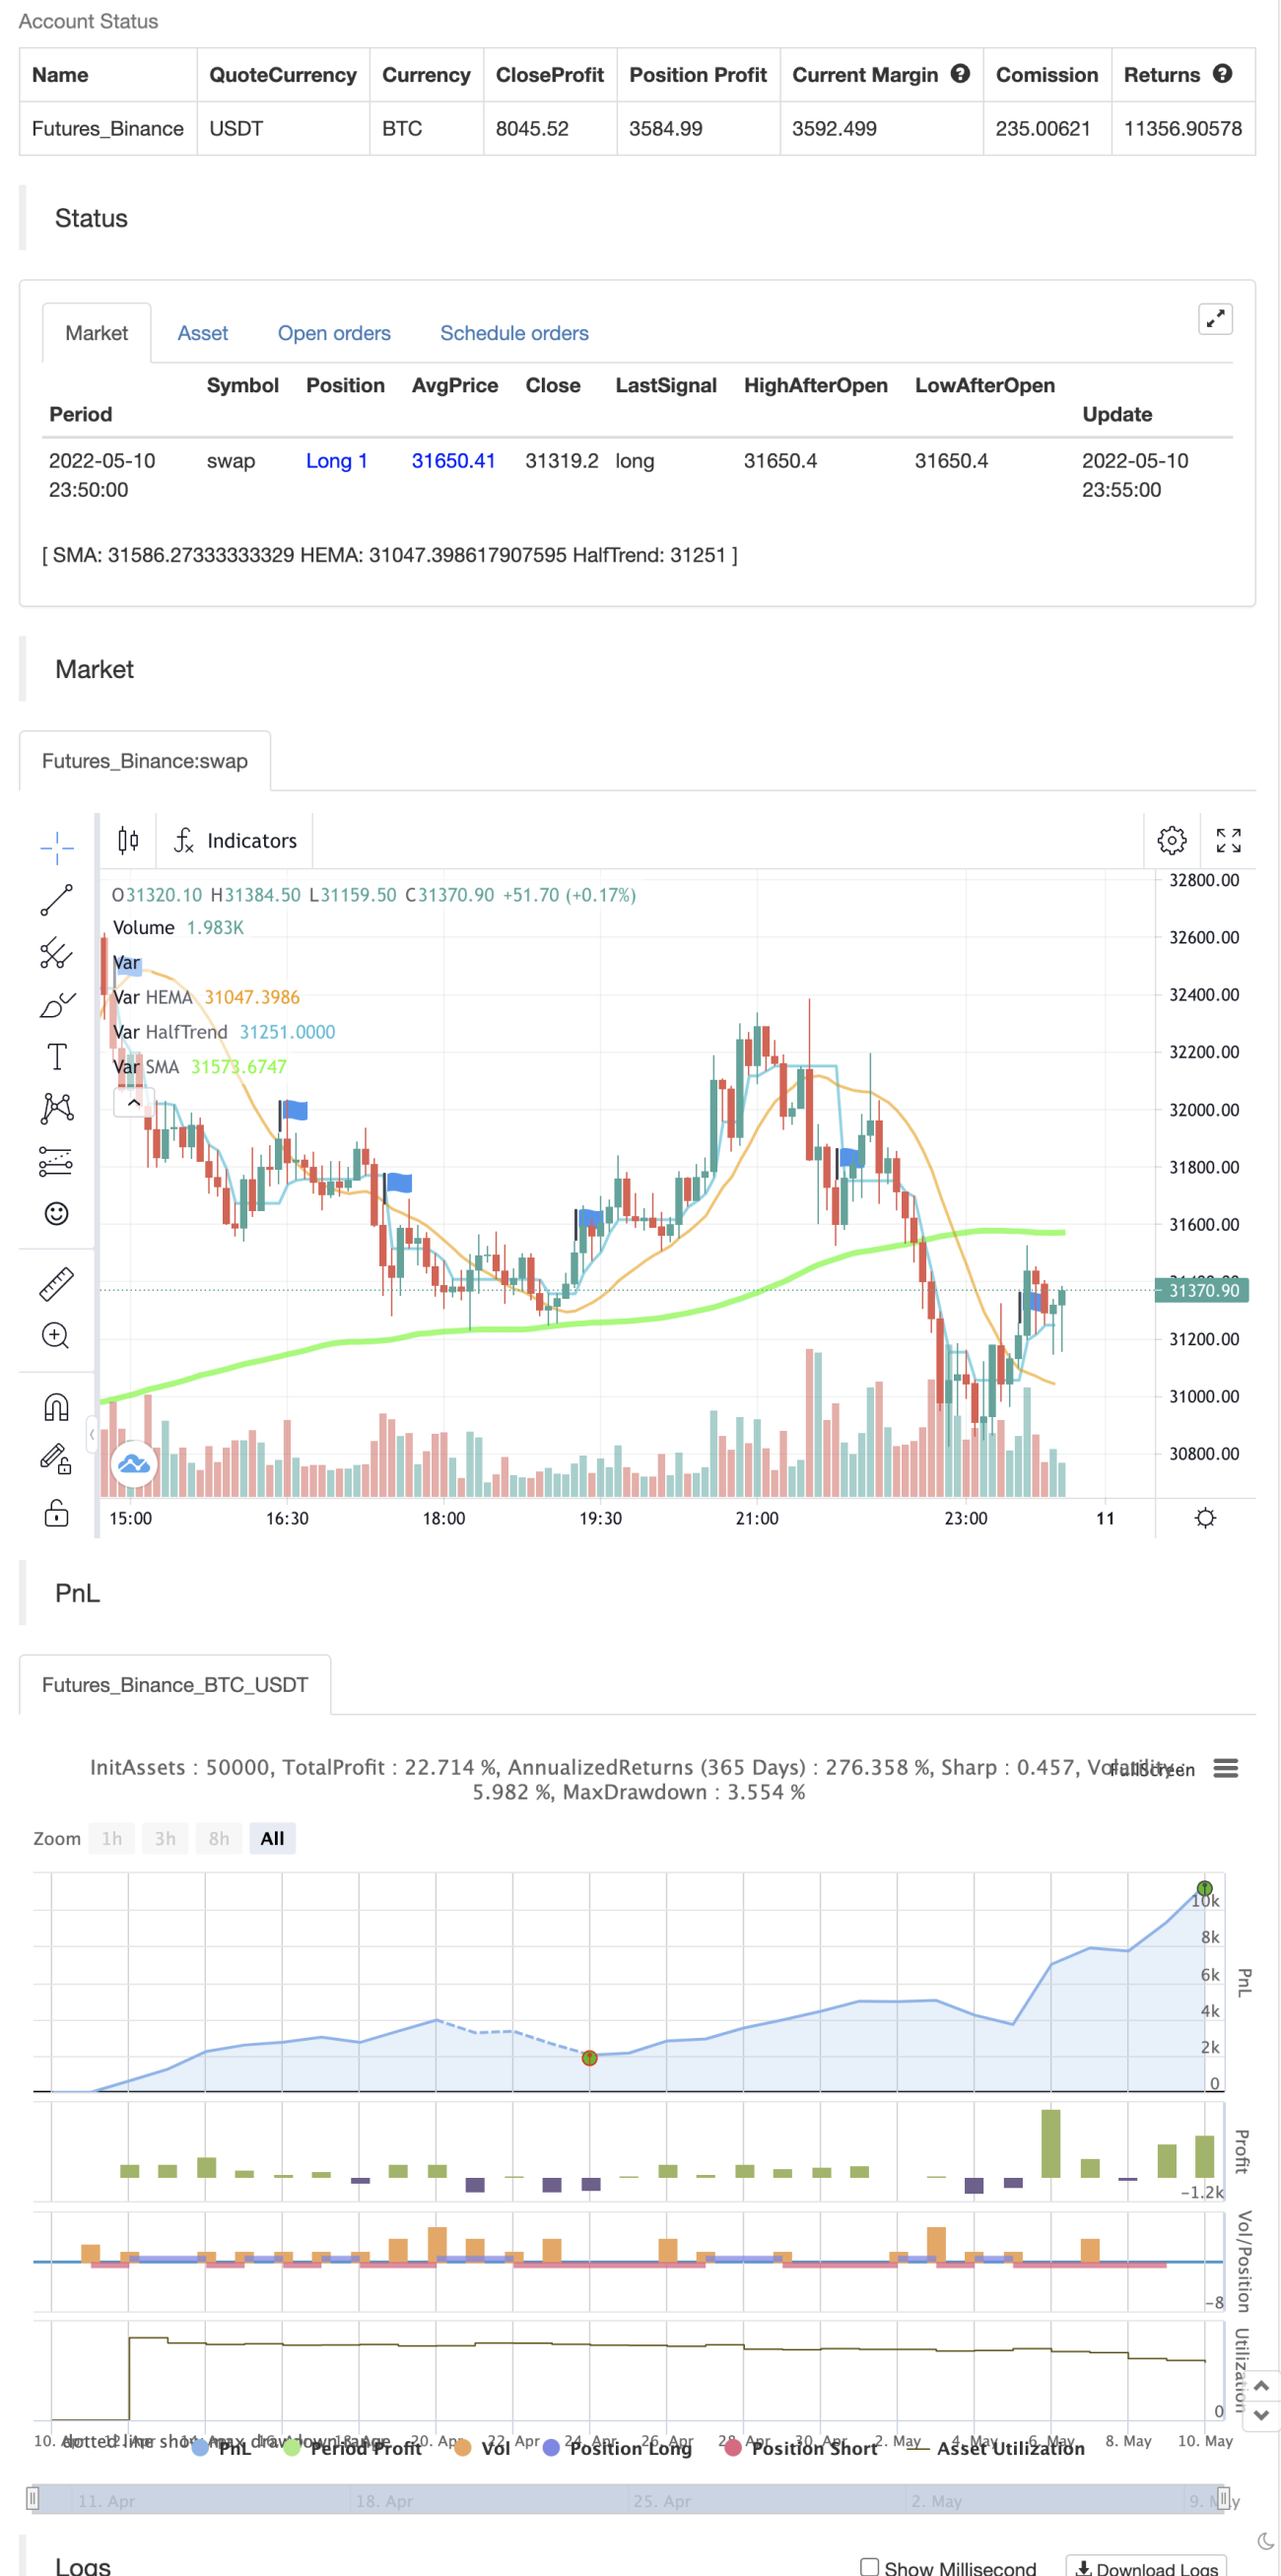
/*backtest
start: 2022-04-11 00:00:00
end: 2022-05-10 23:59:00
period: 5m
basePeriod: 1m
exchanges: [{"eid":"Futures_Binance","currency":"BTC_USDT"}]
*/

// Source code is subject to the terms of the Mozilla Public License 2.0 at https://mozilla.org/MPL/2.0/ - © José Manuel Gassin Pérez-Traverso
// Credit for each indicator belongs to its author.

//@version=5- 1