Chandelier Exit

Author: ChaoZhang, Date: 2022-05-17 17:10:19
Tags: ATR

This is a redesign of the Chandelier Exit indicator. It removes stupid transitions between Chandelier Exit’ states and highlights initial points for both lines.

This indicator was originally developed by Charles Le Beau and popularized by Dr . Alexander Elder in his book “Come Into My Trading Room: A Complete Guide to Trading” (2002).

In short, this is a trailing stop-loss based on the Average True Range (ATR).

backtest img


/*backtest
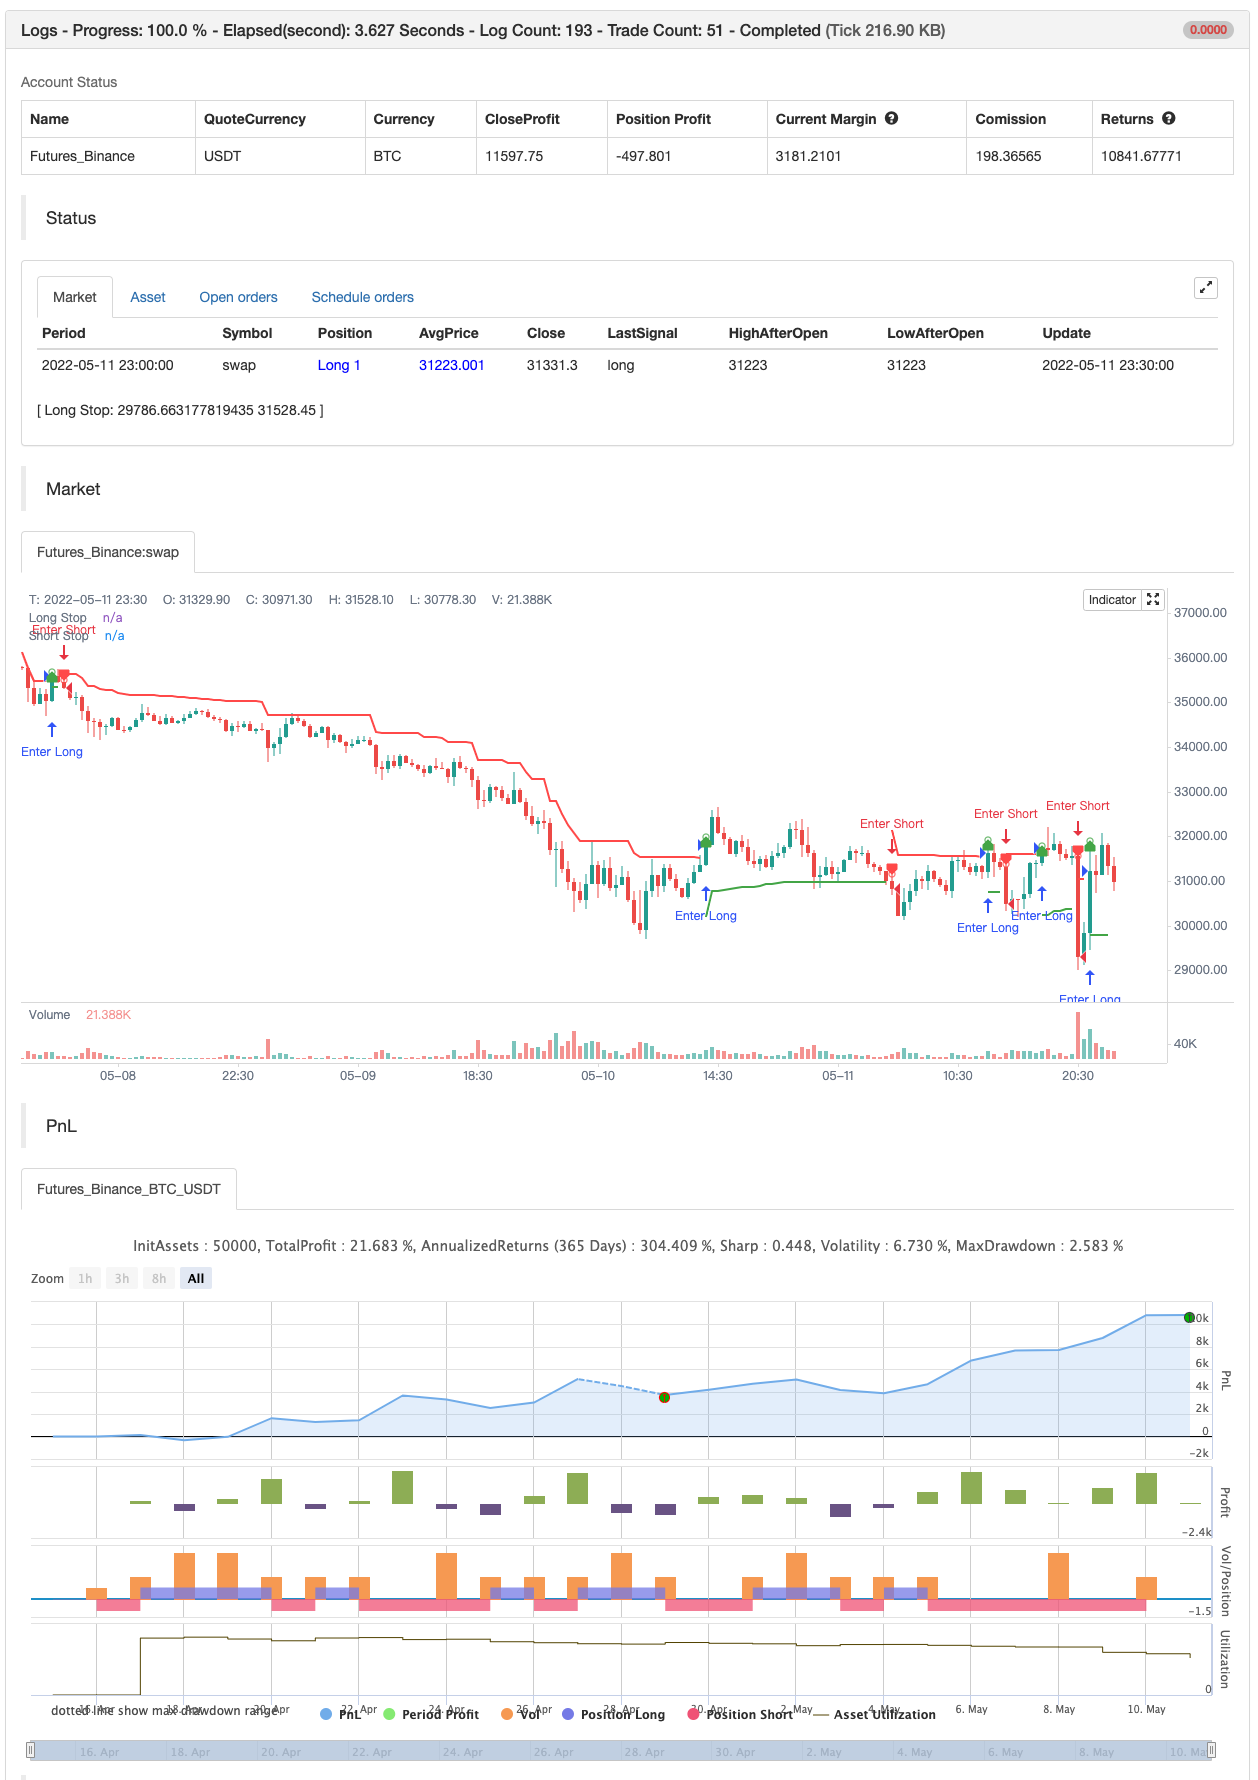
start: 2022-04-16 00:00:00
end: 2022-05-11 23:59:00
period: 30m
basePeriod: 15m
exchanges: [{"eid":"Futures_Binance","currency":"BTC_USDT"}]
*/

//@version=4
// Copyright (c) 2019-present, Alex Orekhov (everget)
// Chandelier Exit script may be freely distributed under the terms of the GPL-3.0 license.
study("Chandelier Exit", shorttitle="CE", overlay=true)

length = input(title="ATR Period", type=input.integer, defval=22)
mult = input(title="ATR Multiplier", type=input.float, step=0.1, defval=3.0)
showLabels = input(title="Show Buy/Sell Labels ?", type=input.bool, defval=true)
useClose = input(title="Use Close Price for Extremums ?", type=input.bool, defval=true)
highlightState = input(title="Highlight State ?", type=input.bool, defval=true)

atr = mult * atr(length)

longStop = (useClose ? highest(close, length) : highest(length)) - atr
longStopPrev = nz(longStop[1], longStop) 
longStop := close[1] > longStopPrev ? max(longStop, longStopPrev) : longStop

shortStop = (useClose ? lowest(close, length) : lowest(length)) + atr
shortStopPrev = nz(shortStop[1], shortStop)
shortStop := close[1] < shortStopPrev ? min(shortStop, shortStopPrev) : shortStop

var int dir = 1
dir := close > shortStopPrev ? 1 : close < longStopPrev ? -1 : dir

var color longColor = color.green
var color shortColor = color.red

longStopPlot = plot(dir == 1 ? longStop : na, title="Long Stop", style=plot.style_linebr, linewidth=2, color=longColor)
buySignal = dir == 1 and dir[1] == -1
plotshape(buySignal ? longStop : na, title="Long Stop Start", location=location.absolute, style=shape.circle, size=size.tiny, color=longColor, transp=0)
plotshape(buySignal and showLabels ? longStop : na, title="Buy Label", text="Buy", location=location.absolute, style=shape.labelup, size=size.tiny, color=longColor, textcolor=color.white, transp=0)

shortStopPlot = plot(dir == 1 ? na : shortStop, title="Short Stop", style=plot.style_linebr, linewidth=2, color=shortColor)
sellSignal = dir == -1 and dir[1] == 1
plotshape(sellSignal ? shortStop : na, title="Short Stop Start", location=location.absolute, style=shape.circle, size=size.tiny, color=shortColor, transp=0)
plotshape(sellSignal and showLabels ? shortStop : na, title="Sell Label", text="Sell", location=location.absolute, style=shape.labeldown, size=size.tiny, color=shortColor, textcolor=color.white, transp=0)

midPricePlot = plot(ohlc4, title="", style=plot.style_circles, linewidth=0, display=display.none, editable=false)

longFillColor = highlightState ? (dir == 1 ? longColor : na) : na
shortFillColor = highlightState ? (dir == -1 ? shortColor : na) : na
fill(midPricePlot, longStopPlot, title="Long State Filling", color=longFillColor)
fill(midPricePlot, shortStopPlot, title="Short State Filling", color=shortFillColor)

changeCond = dir != dir[1]
alertcondition(changeCond, title="Alert: CE Direction Change", message="Chandelier Exit has changed direction!")
alertcondition(buySignal, title="Alert: CE Buy", message="Chandelier Exit Buy!")
alertcondition(sellSignal, title="Alert: CE Sell", message="Chandelier Exit Sell!")


if buySignal
    strategy.entry("Enter Long", strategy.long)
else if sellSignal
    strategy.entry("Enter Short", strategy.short)

Related

More