Trend Tracking Four Elements Strategy

Overview
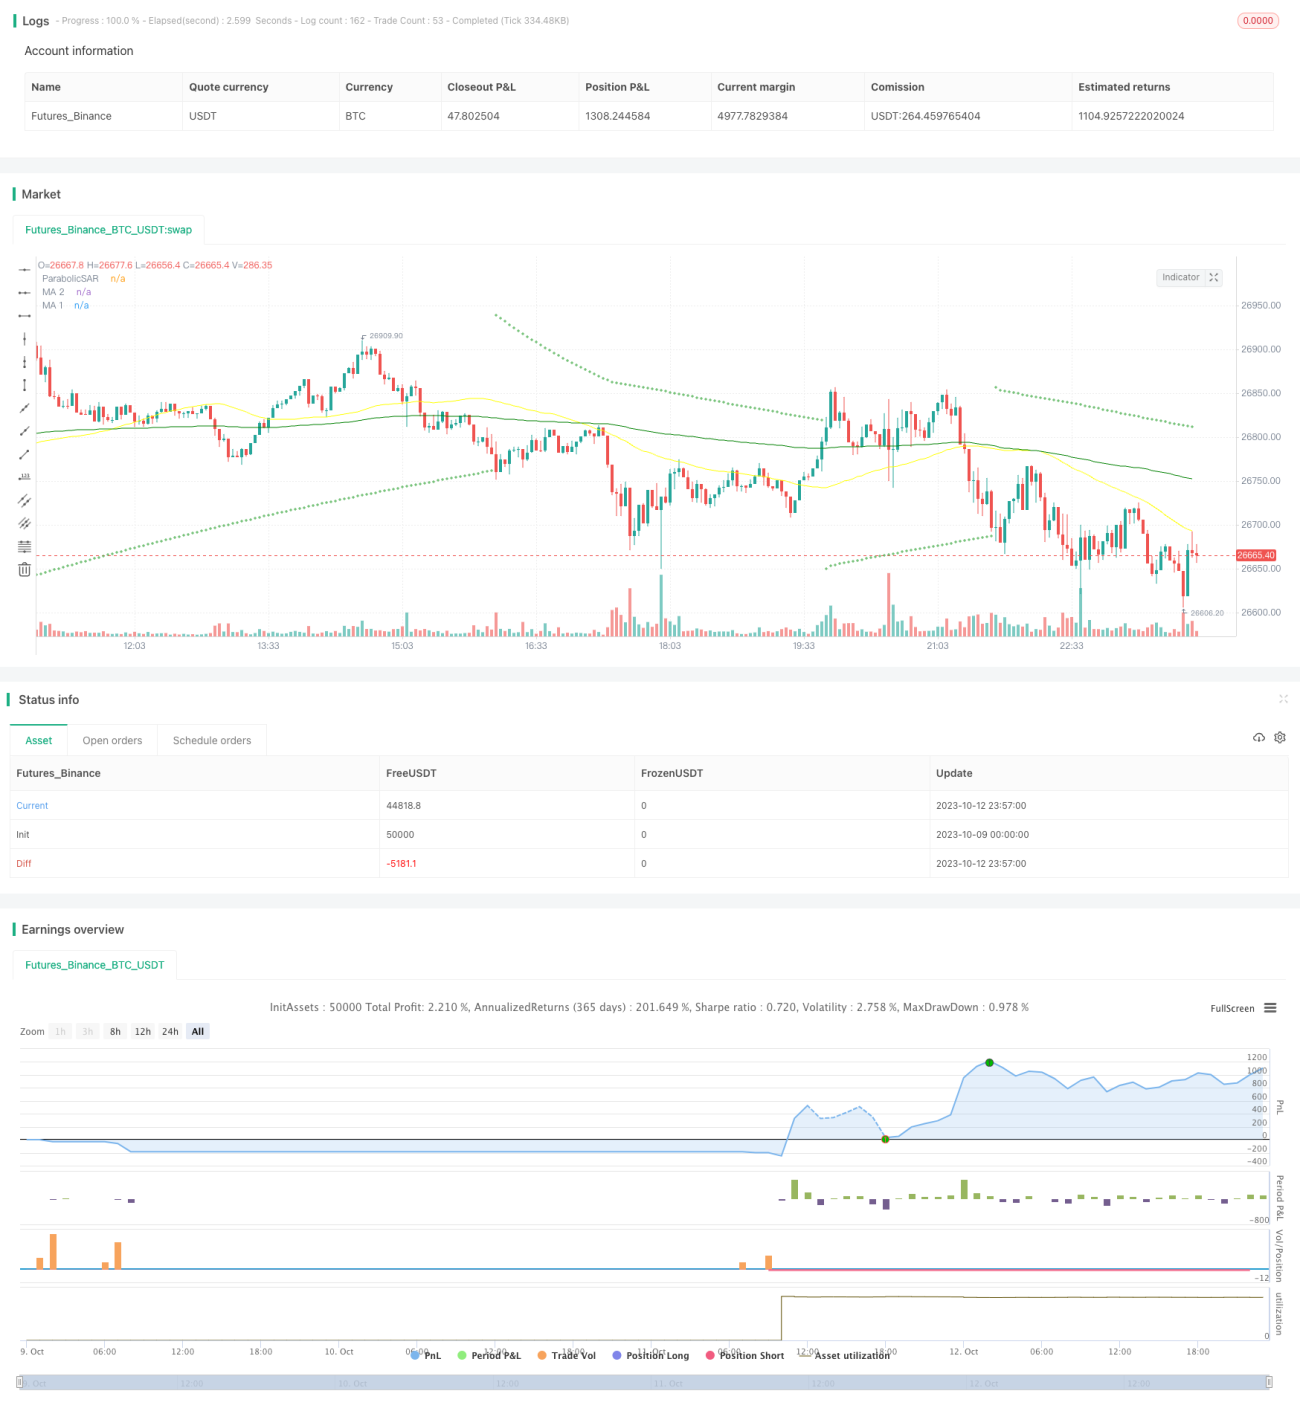
This strategy combines SAR, RSI, Vol and MA indicators to identify trends and adopts robust risk management measures to track trends and profit. The strategy mainly uses the SAR indicator to determine the trend direction, supplemented by the RSI to identify reversal signals at overbought and oversold thresholds, Vol indicator to judge volume characteristics, and MA to determine the primary and secondary trend directions. The combination of multiple indicators helps filter out false signals and identify real trend directions. The risk management sets stop loss and take profit to effectively control single loss and accumulate profits. This strategy is suitable for medium-long term coin holders to obtain steady gains following the mainstream trend.
Strategy Logic
This strategy uses 4 main technical indicators:
-
Parabolic SAR: This indicator uses the relationship between dots and trends to determine trend direction and reversal points. Dots above price suggest uptrend while dots below suggest downtrend. When dots cross through price, it signals a trend reversal. The strategy uses SAR as the main indicator to determine trend direction.
-
RSI: The Relative Strength Index. This indicator oscillates between 0-100 to judge overbought and oversold conditions. RSI above 70 is the overbought zone, below 30 is the oversold zone, and regressing to 50 is the neutral zone. The strategy uses RSI to identify reversal signals at overbought and oversold thresholds.
-
VOL: The volume indicator. The strategy uses VOL to confirm trends and judge the quality of reversal signals by spotting volume expansion patterns.
-
MA: Moving averages. The strategy adopts long and short moving averages to determine the primary and secondary trend directions. The crossover of the short MA above the long MA signifies an upside breakout while the crossover below signifies a downside breakout.
Trade signal rules:
Long condition: SAR dots flip below price bars and RSI turns up from oversold into the neutral zone, obvious VOL expansion, short MA crosses above long MA.
Short condition: SAR dots flip above price bars and RSI turns down from overbought into the neutral zone, obvious VOL expansion, short MA crosses below long MA.
The strategy also sets stop loss and take profit risk management rules. Take profit is set at 2x the entry price and stop loss is set at 0.8x the entry price to lock in profits and control risks.
Advantage Analysis
The advantages of this strategy include:
-
The multi-indicator combo avoids false signals and truly captures trend reversals.
-
Risk management with stop loss and take profit effectively controls risk.
-
Position sizing with scaled entries and tiered take profits maximizes profits.
-
Robust parameters obtained through repeated optimization and testing.
-
Sufficient backtest data simulates real trading conditions.
-
Simple and clear logic easy to understand and implement.
Risk Analysis
The risks of this strategy include:
-
Extreme market volatility breaking stop loss. Wider stop loss is recommended.
-
Illiquid trading products failing to fill stop loss. Products with good liquidity should be selected.
-
Systemic risks causing gap moves. Leverage should be reduced and assets with strong fundamentals should be held.
-
Overly optimized parameters leading to too perfect results. Parameters should be relaxed to improve robustness.
-
High trading frequency incurring excessive slippage costs. Wider signal generation interval could be adopted.
-
Deteriorating signal efficiency requiring timely updates. Regular backtests and parameter tuning is needed.
Improvement Directions
This strategy can be further enhanced in the following aspects:
-
Test more indicator combos like MACD, KD to find better matches.
-
Optimize MA periods to identify clearer primary and secondary trends.
-
Optimize stop loss and take profit coefficients for optimal risk-reward ratio.
-
Test parameter robustness across different products and find optimal parameter sets.
-
Incorporate machine learning models to aid in trade signal generation.
-
Adopt adaptive stop loss algorithms to make stop loss more dynamic.
-
Test longer period parameters to expand profit potential.
Conclusion
This strategy combines multiple indicators to filter out false signals and determine trend direction, sets stop loss and take profit to control risks, and optimizes parameters and combinations to continuously improve strategy performance. Although no strategy can perfectly predict the future, systematic trading plans coupled with proper risk management will substantially increase profitability. This strategy provides a relatively robust trend tracking framework suitable for investors seeking long term steady gains in a rational manner.
- 1