Dow Theory based RSI/MFI Momentum Indicator Strategy

1
Follow
1779
Followers
Overview
This strategy uses Relative Strength Index (RSI) or Money Flow Index (MFI) to judge if the market is bull or bear, combined with the bull-bear coefficient from Dow Theory to calculate the adjusted probability distribution. Different entry and exit logic are adopted according to different market types.
Strategy Principle
- Calculate RSI or MFI to judge the current market state (bull or bear)
- Calculate Dow Theory bull-bear coefficient to reflect the correlation between current price and volume
- Adjust RSI/MFI probability distribution to determine precise long/short distribution
- Decide whether to entry based on current sessionId and probability
- Stop loss when profit taking or sideways market
Advantage Analysis
- More accurate judgement of market type combined with Dow Theory
- Consider sideways factor to avoid blindly entry
- High risk-reward ratio and low drawdown
Risk Analysis
- Multiple misjudgements may happen with improper parameters
- Enough historical data is needed to support
- Simple stop loss logic cannot be optimized for special market situations
Optimization Direction
- Consider combining more indicators to judge market session
- Add more rigorous stop loss logic based on volatility, historical data etc.
- Try machine learning etc. to determine better parameters
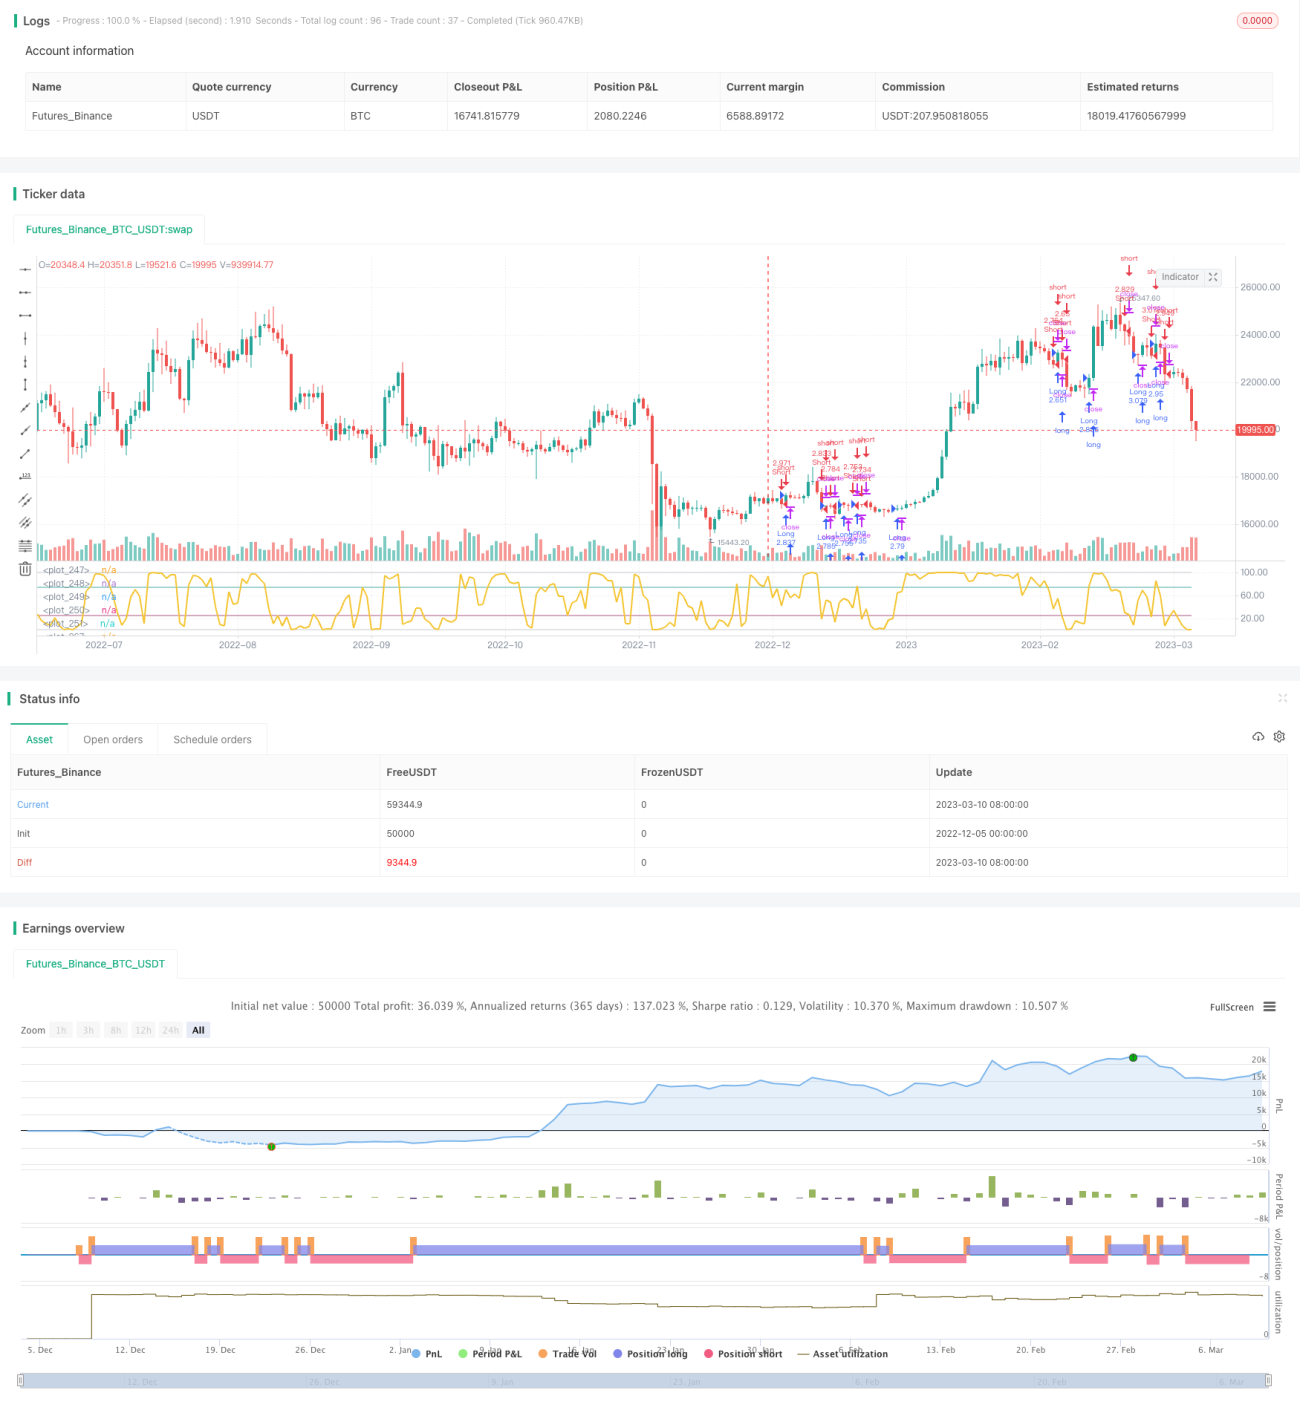
Summary
The overall backtest result of this strategy is good and has certain practical value. But further test and adjustment is still needed, especially for the stop loss logic. It works better as an assist judgement indicator, cannot follow blindly.
Source
Pine
Strategy parameters
Related strategies
Comment
All comments (0)
No data
- 1