Momentum Breakout Intraday Trading Strategy

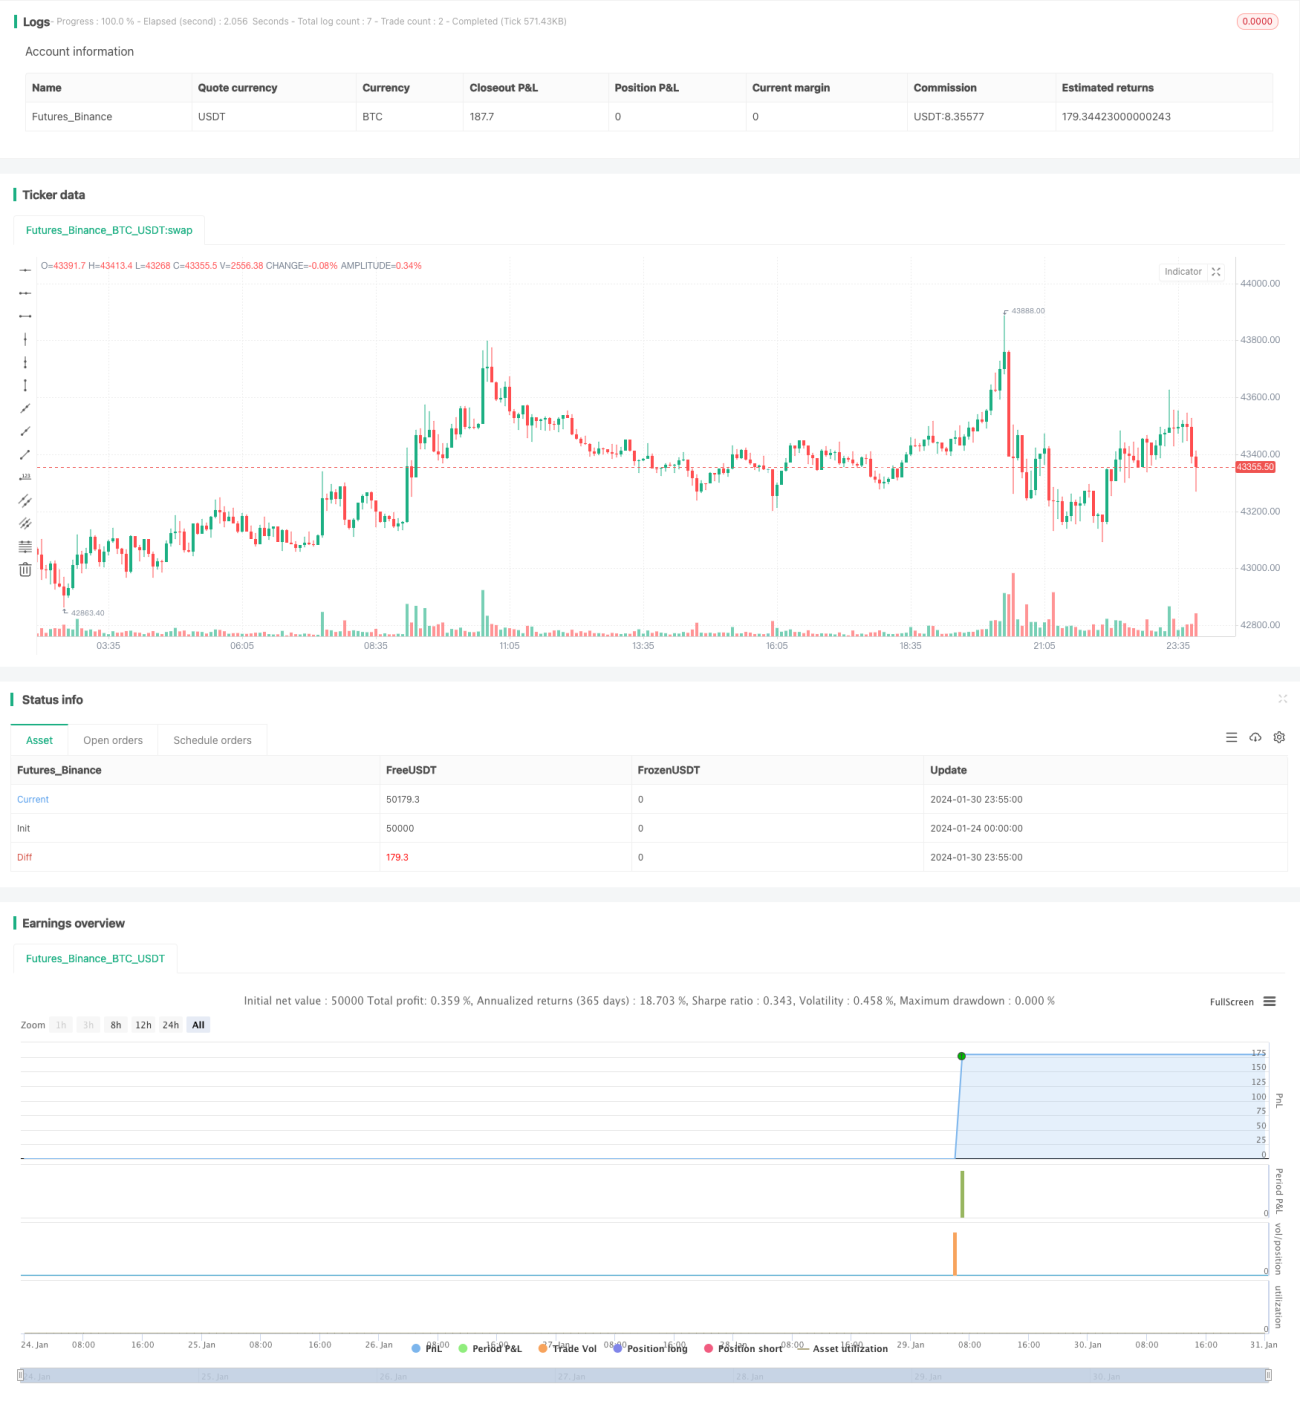
Overview
This strategy tracks SPY trading data and makes buy and sell decisions to realize intraday trading profits through a combination of technical indicators such as moving averages, MACD, RSI to accurately determine short-term trends.
Strategy Logic
The core logic of this strategy is based on the following technical indicators to determine short-term trends and entry points:
- The golden cross and death cross of the 5-day and 13-day exponential moving averages (EMA) are used to determine the turning point of bullish and bearish trends.
- The MACD indicator is used to determine if there is upward momentum.
- The ADX indicator is used to determine if a trend exists.
- The RSI indicator is used to determine the strength of the trend.
By optimizing the parameters of the above indicators, key reversal points of bullish and bearish trends can be determined. When 5 out of 6 conditions are met, white L or S signals are displayed. When all six conditions are fully met, gold △ shapes are displayed on the candlestick bar close.
Long entry signal conditions:
5-day EMA greater than 13-day EMA AND MACD line less than 0.5 AND ADX greater than 20 AND MACD slope greater than 0 AND signal line greater than -0.1 AND RSI greater than 40
Short entry signal conditions:
5-day EMA less than 13-day EMA AND MACD line greater than -0.5 AND ADX greater than 20 AND signal line less than 0 AND MACD slope less than 0 AND RSI less than 60
Advantage Analysis
The advantages of this strategy include:
- Higher accuracy from combining multiple indicator signals.
- Balanced sensitivity and accuracy through parameter optimization.
- Simple and clear signals, low barrier to operation.
- Suitable for intraday trading, matches most investors' risk appetite.
- Avoids high volatility in late trading by not placing orders.
Risk Analysis
The risks of this strategy include:
- Incorrect judgments from improper parameter settings. Continuous testing and optimization needed.
- Single asset, unable to diversify industry and asset allocation risks.
- Frequent trading leads to transaction fee and slippage risks.
- Missing some opportunities by not trading in late trading sessions.
Optimization Directions
The strategy can be further optimized in the following aspects:
- Test modifying parameter settings to improve judgment accuracy.
- Add stop loss indicators to control single loss.
- Optimize order placing time to filter out high volatility periods.
- Add other products as strategy targets.
- Incorporate machine learning algorithms to improve parameter self-adaptiveness.
Conclusion
This strategy determines short-term trends by tracking SPY data and combining multiple technical indicators such as moving averages, MACD and RSI. With high operation frequency, low drawdowns, it is very suitable for intraday trading. There is still large room for improvement through optimizations from multiple dimensions.
/*backtest
start: 2024-01-24 00:00:00
end: 2024-01-31 00:00:00
period: 5m
basePeriod: 1m
exchanges: [{"eid":"Futures_Binance","currency":"BTC_USDT"}]
*/

//@version=5
strategy(title="SPY 1 Minute Day Trader", overlay=true)

//This script has been created to take into account how the following variables impact trend for SPY 1 Minute- 1