Dynamic Take Profit Bollinger Bands Strategy

Overview
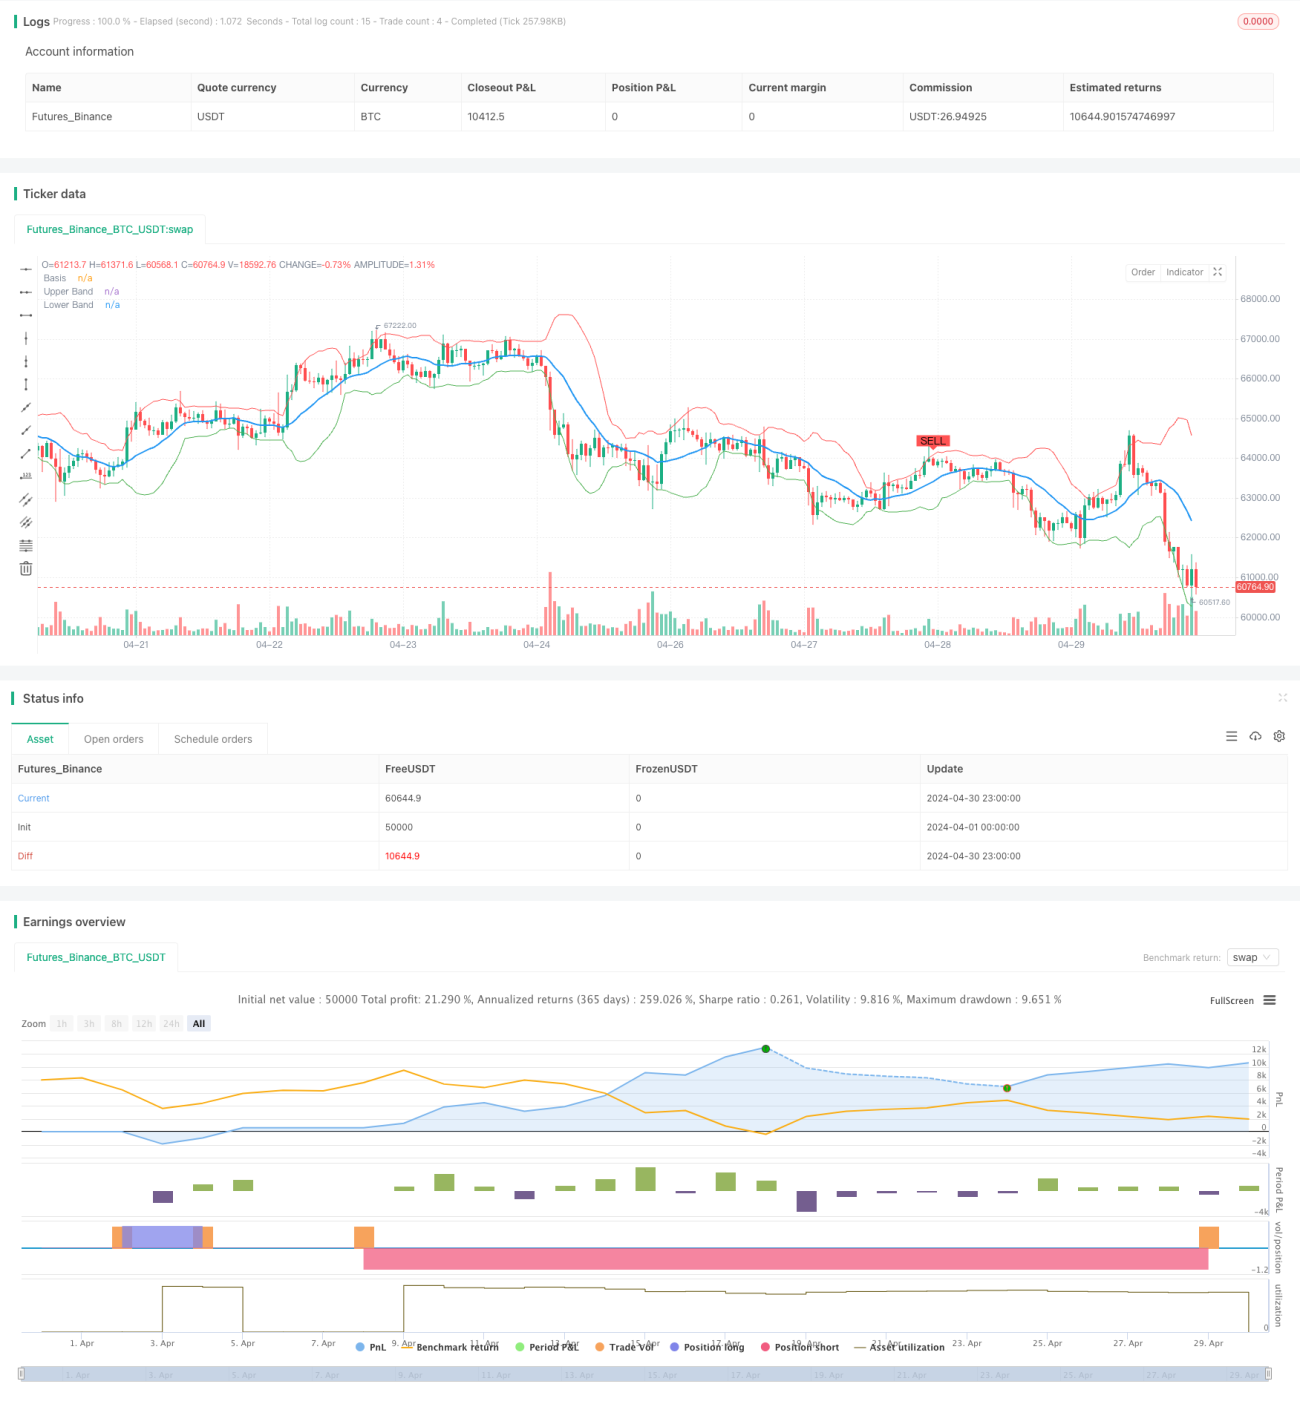
This strategy utilizes the Bollinger Bands indicator to go short when the price touches the upper band and go long when it touches the lower band. It sets a dynamic take profit level and closes the position when it reaches 1% profit. The core idea is that the price always fluctuates within the Bollinger Bands and has a mean-reverting characteristic, so we can take reverse positions when the price deviates too far from the moving average to capture the price difference.
Strategy Principles
- Calculate the moving average and standard deviation: Use the Simple Moving Average (SMA) to calculate the moving average of the closing price (basis), and then calculate the standard deviation (dev) of the closing price relative to the moving average.
- Calculate the upper and lower bands: The upper band is basis + dev * multiplier, and the lower band is basis - dev * multiplier, where multiplier is a multiple of the volatility amplitude.
- Generate trading signals: When the closing price crosses above the lower band and the current close is less than the open, a long signal is generated; when the closing price crosses below the upper band and the current close is greater than the open, a short signal is generated.
- Dynamic take profit: After opening a position, calculate the take profit price based on the entry price and the take profit percentage. Close the position when the price reaches the take profit level.
- Visualization: Plot the Bollinger Bands, moving average, and trading signals on the chart.
Strategy Advantages
- Simple and effective: The strategy logic is clear and uses only one technical indicator, making it easy to understand and implement.
- Wide applicability: Bollinger Bands have universal applicability and can be used for various trading instruments and markets.
- Dynamic take profit: Compared to fixed take profit, dynamic take profit can maximize the profit of winning trades while controlling risk.
- Effectively capture trends: In trending markets, after the price touches the upper or lower band, it usually continues to move in the original direction for some time. This strategy can effectively seize such trend opportunities.
Strategy Risks
- Poor performance in ranging markets: When the market is in wide fluctuations and prices repeatedly break through the Bollinger Bands, the strategy may generate frequent trading signals, resulting in excessive trading and increased transaction costs.
- Deep retracements in trending markets: If a trend lasts for a long time and prices deviate from the moving average for an extended period, the strategy goes against the trend, potentially leading to deep retracements.
- Difficulty in parameter selection: The parameters of the Bollinger Bands (such as length and multiplier) have a significant impact on the strategy performance, but there are no universally optimal parameters.
Strategy Optimization Directions
- Incorporate trend analysis: Add trend identification indicators (such as moving averages) to the strategy. In trending markets, trading can be suspended or follow the trend.
- Optimize take profit and stop loss: Dynamically adjust the take profit and stop loss based on volatility indicators such as ATR to achieve a better risk-reward ratio.
- Multi-factor combination: Consider combining Bollinger Bands with other technical indicators (such as RSI, MACD, etc.) to improve signal accuracy and reduce false signals.
- Fundamental filtering: After generating trading signals, use fundamental data (such as financial reports, industry data, etc.) for secondary confirmation to enhance the robustness of the strategy.
Summary
This strategy constructs a simple and effective trading system using Bollinger Bands, taking the price touching the upper and lower bands as signals, and adopting dynamic take profit to control risk. The strategy performs well in trending markets but may face frequent trading issues in ranging markets. Further improvements can be made in terms of trend analysis, take profit and stop loss optimization, factor combination, and fundamental filtering to achieve more robust returns.
- 1