Multi-Period Moving Average and RSI Momentum Cross Trend Following Strategy

Overview
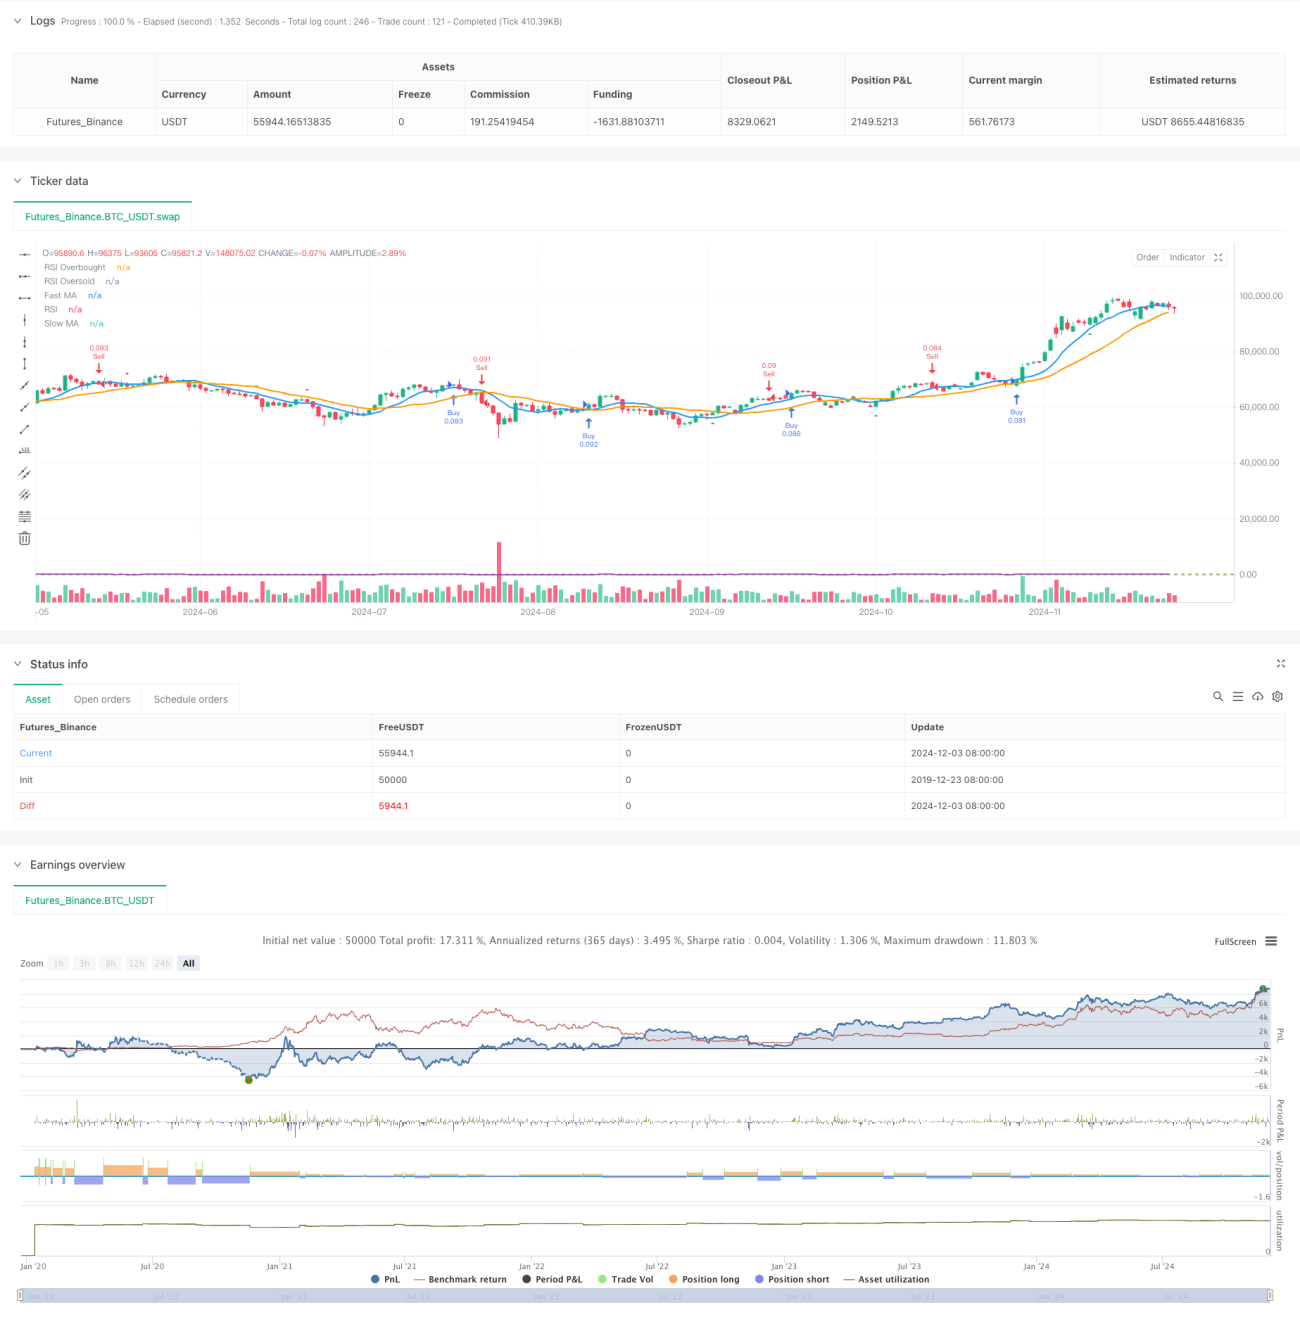
This strategy is a comprehensive trading system that combines multiple-period moving averages, RSI overbought/oversold signals, and price pattern recognition. The strategy primarily generates trading signals by identifying market trend turning points through the intersection of fast and slow moving averages, RSI indicator's overbought/oversold zones, and bullish/bearish engulfing patterns. The strategy employs percentage-based position management, using 10% of account equity by default for each trade, which helps achieve better risk control.
Strategy Principles
The core logic of the strategy is based on the following key elements:
- Moving Average System: Uses 9-period and 21-period Simple Moving Averages (SMA) as fast and slow lines to determine trend direction through crossovers.
- RSI Momentum Indicator: Employs 14-period RSI with 70 as overbought and 30 as oversold levels to confirm price momentum.
- Price Pattern Recognition: Programmatically identifies bullish and bearish engulfing patterns as auxiliary trading signals.
- Signal Integration: Buy signals require fast MA crossing above slow MA with RSI in oversold zone or bullish engulfing pattern; sell signals require fast MA crossing below slow MA with RSI in overbought zone or bearish engulfing pattern.
Strategy Advantages
- Multi-dimensional Signal Confirmation: Combines technical indicators and price patterns to improve signal reliability.
- Comprehensive Risk Control: Uses account percentage position sizing to effectively control risk per trade.
- Trend Following Capability: Effectively captures medium to long-term trends through the moving average system.
- Signal Visualization: Provides clear graphical interface including moving averages, RSI indicator, and trade signal markers.
- Flexible Parameter Settings: Allows adjustment of MA periods, RSI parameters, etc., to adapt to different market conditions.
Strategy Risks
- Choppy Market Risk: May generate frequent false breakout signals in sideways markets.
- Lag Risk: Moving averages are inherently lagging indicators, potentially missing optimal entry points.
- Parameter Sensitivity: Optimal parameters may vary significantly across different market environments.
- Pattern Recognition Accuracy: Programmatically identified patterns may deviate from actual market patterns.
Strategy Optimization Directions
- Introduce Volatility Filtering: Recommend adding ATR indicator to filter trading signals in low volatility environments.
- Optimize Stop Loss Mechanism: Can implement dynamic stop losses based on ATR for more flexible risk control.
- Add Market Environment Analysis: Introduce trend strength indicators to use different parameter combinations in different market conditions.
- Improve Position Management: Can dynamically adjust position size based on signal strength and market volatility.
- Add Time Filtering: Consider market time characteristics to avoid trading during specific time periods.
Summary
This is a well-designed, logically sound comprehensive technical analysis trading strategy. By combining multiple technical indicators and price patterns, the strategy achieves reliable signal generation while maintaining good risk control. Although it has some inherent limitations, the strategy's overall performance can be further improved through the suggested optimization directions. Users need to pay attention to parameter optimization and market environment adaptation in practical applications to achieve optimal trading results.
/*backtest
start: 2019-12-23 08:00:00
end: 2024-12-04 00:00:00
period: 1d
basePeriod: 1d
exchanges: [{"eid":"Futures_Binance","currency":"BTC_USDT"}]
*/

//@version=5
strategy("Comprehensive Trading Strategy", overlay=true, default_qty_type=strategy.percent_of_equity, default_qty_value=10)

// Input parameters for moving averages- 1