概述
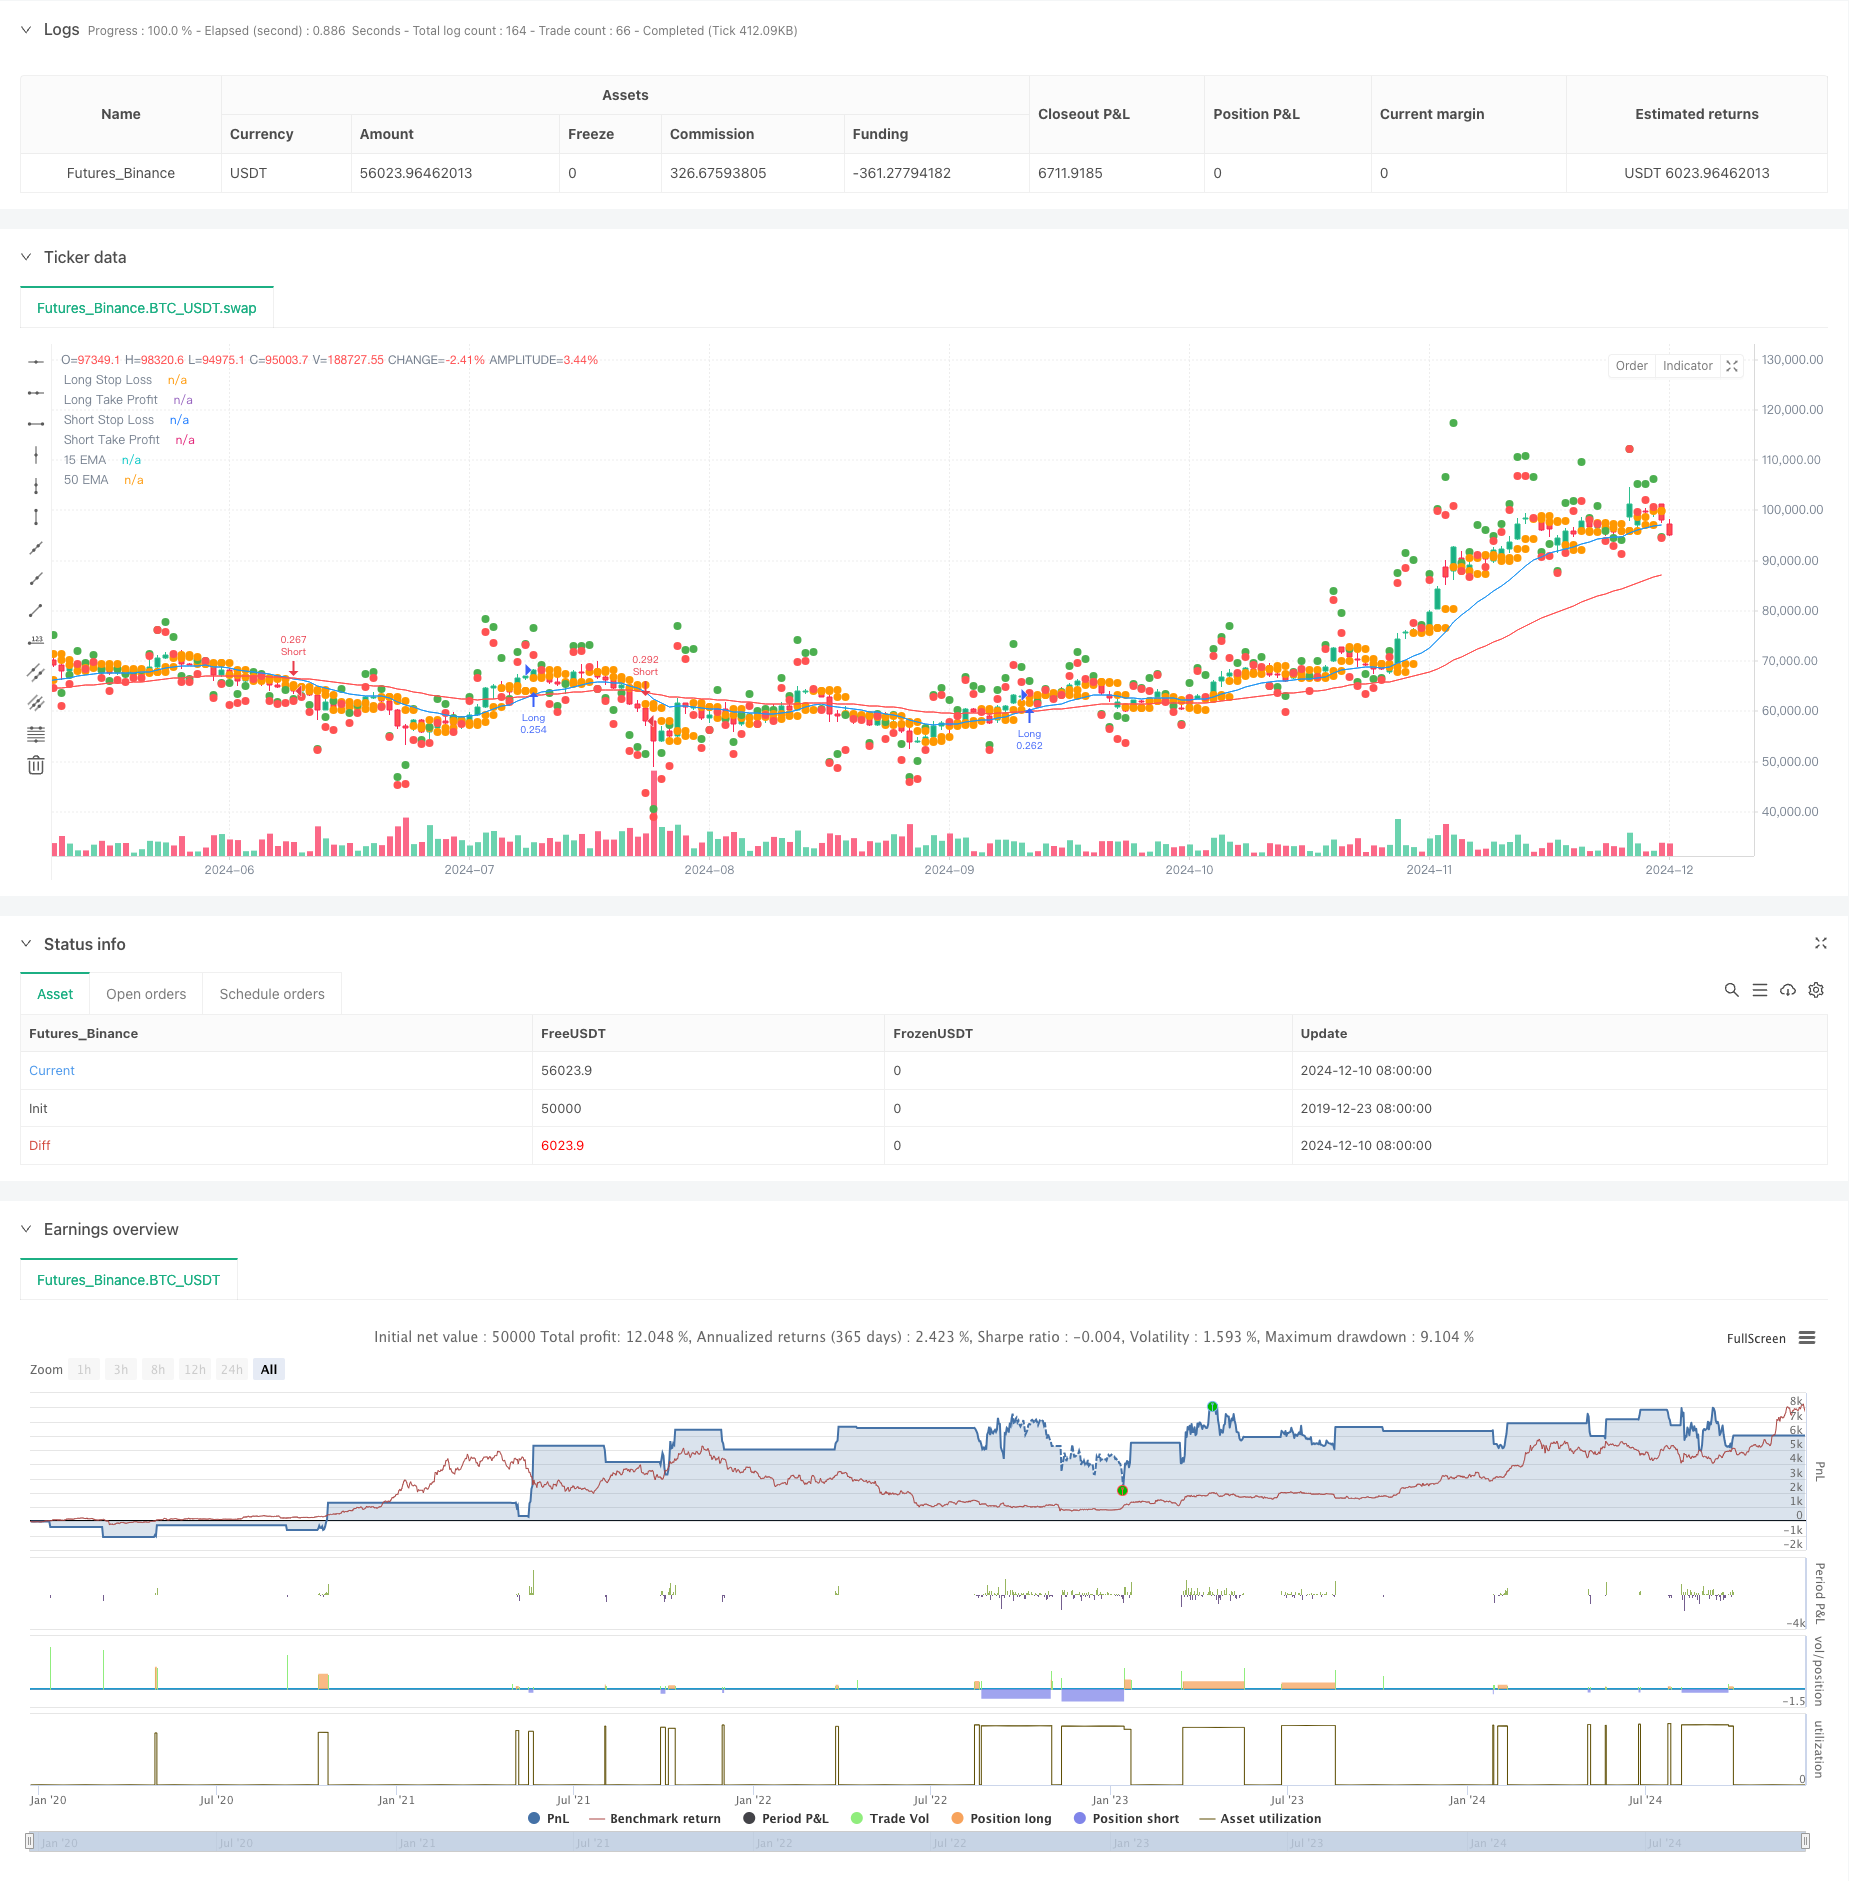
这是一个基于15周期和50周期指数移动平均线(EMA)交叉的交易策略。策略通过智能设置止损和获利点,实现了风险收益比的最优控制。该策略不仅能够捕捉趋势反转信号,还能够根据市场波动自动调整交易参数,从而提高策略的稳定性和盈利能力。
策略原理
策略的核心逻辑基于快速EMA(15周期)和慢速EMA(50周期)的交叉信号。当快线上穿慢线时,系统产生做多信号;当快线下穿慢线时,系统产生做空信号。为了优化风险管理,策略采用了动态止损设置方法,即以前2根K线的最低开盘价作为多头止损点,最高开盘价作为空头止损点。获利目标则通过风险的2倍来设定,确保了良好的风险收益比。策略默认使用账户30%的资金进行交易,这种资金管理方式有助于控制风险。
策略优势
- 动态风险管理:通过实时计算止损位置,策略能够根据市场波动自动调整风险参数。
- 优化的风险收益比:通过将获利目标设置为止损距离的2倍,确保了每笔交易都具有合理的盈利空间。
- 稳健的资金管理:使用账户30%的资金进行交易,既保证了收益潜力,又避免了过度风险。
- 双向交易机会:策略可以捕捉多空两个方向的交易机会,提高了交易频率和盈利机会。
- 可视化辅助:通过在图表上标记止损和获利位置,交易者可以直观地监控交易状态。
策略风险
- 震荡市场风险:在横盘震荡市场中,均线交叉信号可能产生虚假信号,导致连续止损。
- 滑点风险:在市场快速波动时,实际成交价格可能与理想价格存在较大偏差。
- 资金管理风险:固定使用30%的资金可能在某些市场条件下过于激进。
- 止损设置风险:基于前2根K线设置的止损可能在极端市场条件下不够灵活。
策略优化方向
- 引入趋势过滤器:可以添加额外的趋势确认指标,如ADX或趋势强度指标,以过滤弱势信号。
- 动态资金管理:可以根据市场波动率自动调整仓位大小,使策略更具适应性。
- 优化止损方法:可以考虑引入ATR指标来设置止损,使止损更符合市场波动特征。
- 增加时间过滤:添加交易时间段过滤,避开波动剧烈或流动性不足的时段。
- 引入成交量确认:将成交量作为交易信号的确认指标,提高信号可靠性。
总结
这是一个结构完整、逻辑清晰的均线交叉策略。通过将经典的技术分析方法与现代风险管理技术相结合,策略实现了较好的风险收益特征。虽然存在一定的优化空间,但策略的基本框架具有良好的实用性和扩展性。通过建议的优化方向,策略的表现有望得到进一步提升。
策略源码
/*backtest
start: 2019-12-23 08:00:00
end: 2024-12-11 08:00:00
period: 1d
basePeriod: 1d
exchanges: [{"eid":"Futures_Binance","currency":"BTC_USDT"}]
*/

//@version=5
strategy("EMA Cross - Any Direction", overlay=true, default_qty_type=strategy.percent_of_equity, default_qty_value=30)

// Input for EMAs
ema_short_length = input(15, title="Short EMA Length")
ema_long_length = input(50, title="Long EMA Length")

// Calculate EMAs
ema_short = ta.ema(close, ema_short_length)
ema_long = ta.ema(close, ema_long_length)

// Plot EMAs
plot(ema_short, color=color.blue, title="15 EMA")
plot(ema_long, color=color.red, title="50 EMA")

// Entry Conditions (Any EMA Cross)
cross_condition = ta.crossover(ema_short, ema_long) or ta.crossunder(ema_short, ema_long)

// Determine Trade Direction
is_long = ta.crossover(ema_short, ema_long)
is_short = ta.crossunder(ema_short, ema_long)

// Stop Loss and Take Profit
long_stop_loss = ta.lowest(open[1], 2)  // Lowest open of the last 2 candles
short_stop_loss = ta.highest(open[1], 2) // Highest open of the last 2 candles
long_take_profit = close + 2 * (close - long_stop_loss)
short_take_profit = close - 2 * (short_stop_loss - close)

// Execute Trades
if (cross_condition)
    if (is_long)
        strategy.entry("Long", strategy.long)
        strategy.exit("Exit Long", "Long", stop=long_stop_loss, limit=long_take_profit)
    else if (is_short)
        strategy.entry("Short", strategy.short)
        strategy.exit("Exit Short", "Short", stop=short_stop_loss, limit=short_take_profit)

// Plot Stop Loss and Take Profit Levels
plot(long_stop_loss, color=color.orange, title="Long Stop Loss", style=plot.style_circles, linewidth=2)
plot(long_take_profit, color=color.green, title="Long Take Profit", style=plot.style_circles, linewidth=2)
plot(short_stop_loss, color=color.orange, title="Short Stop Loss", style=plot.style_circles, linewidth=2)
plot(short_take_profit, color=color.red, title="Short Take Profit", style=plot.style_circles, linewidth=2)
相关推荐