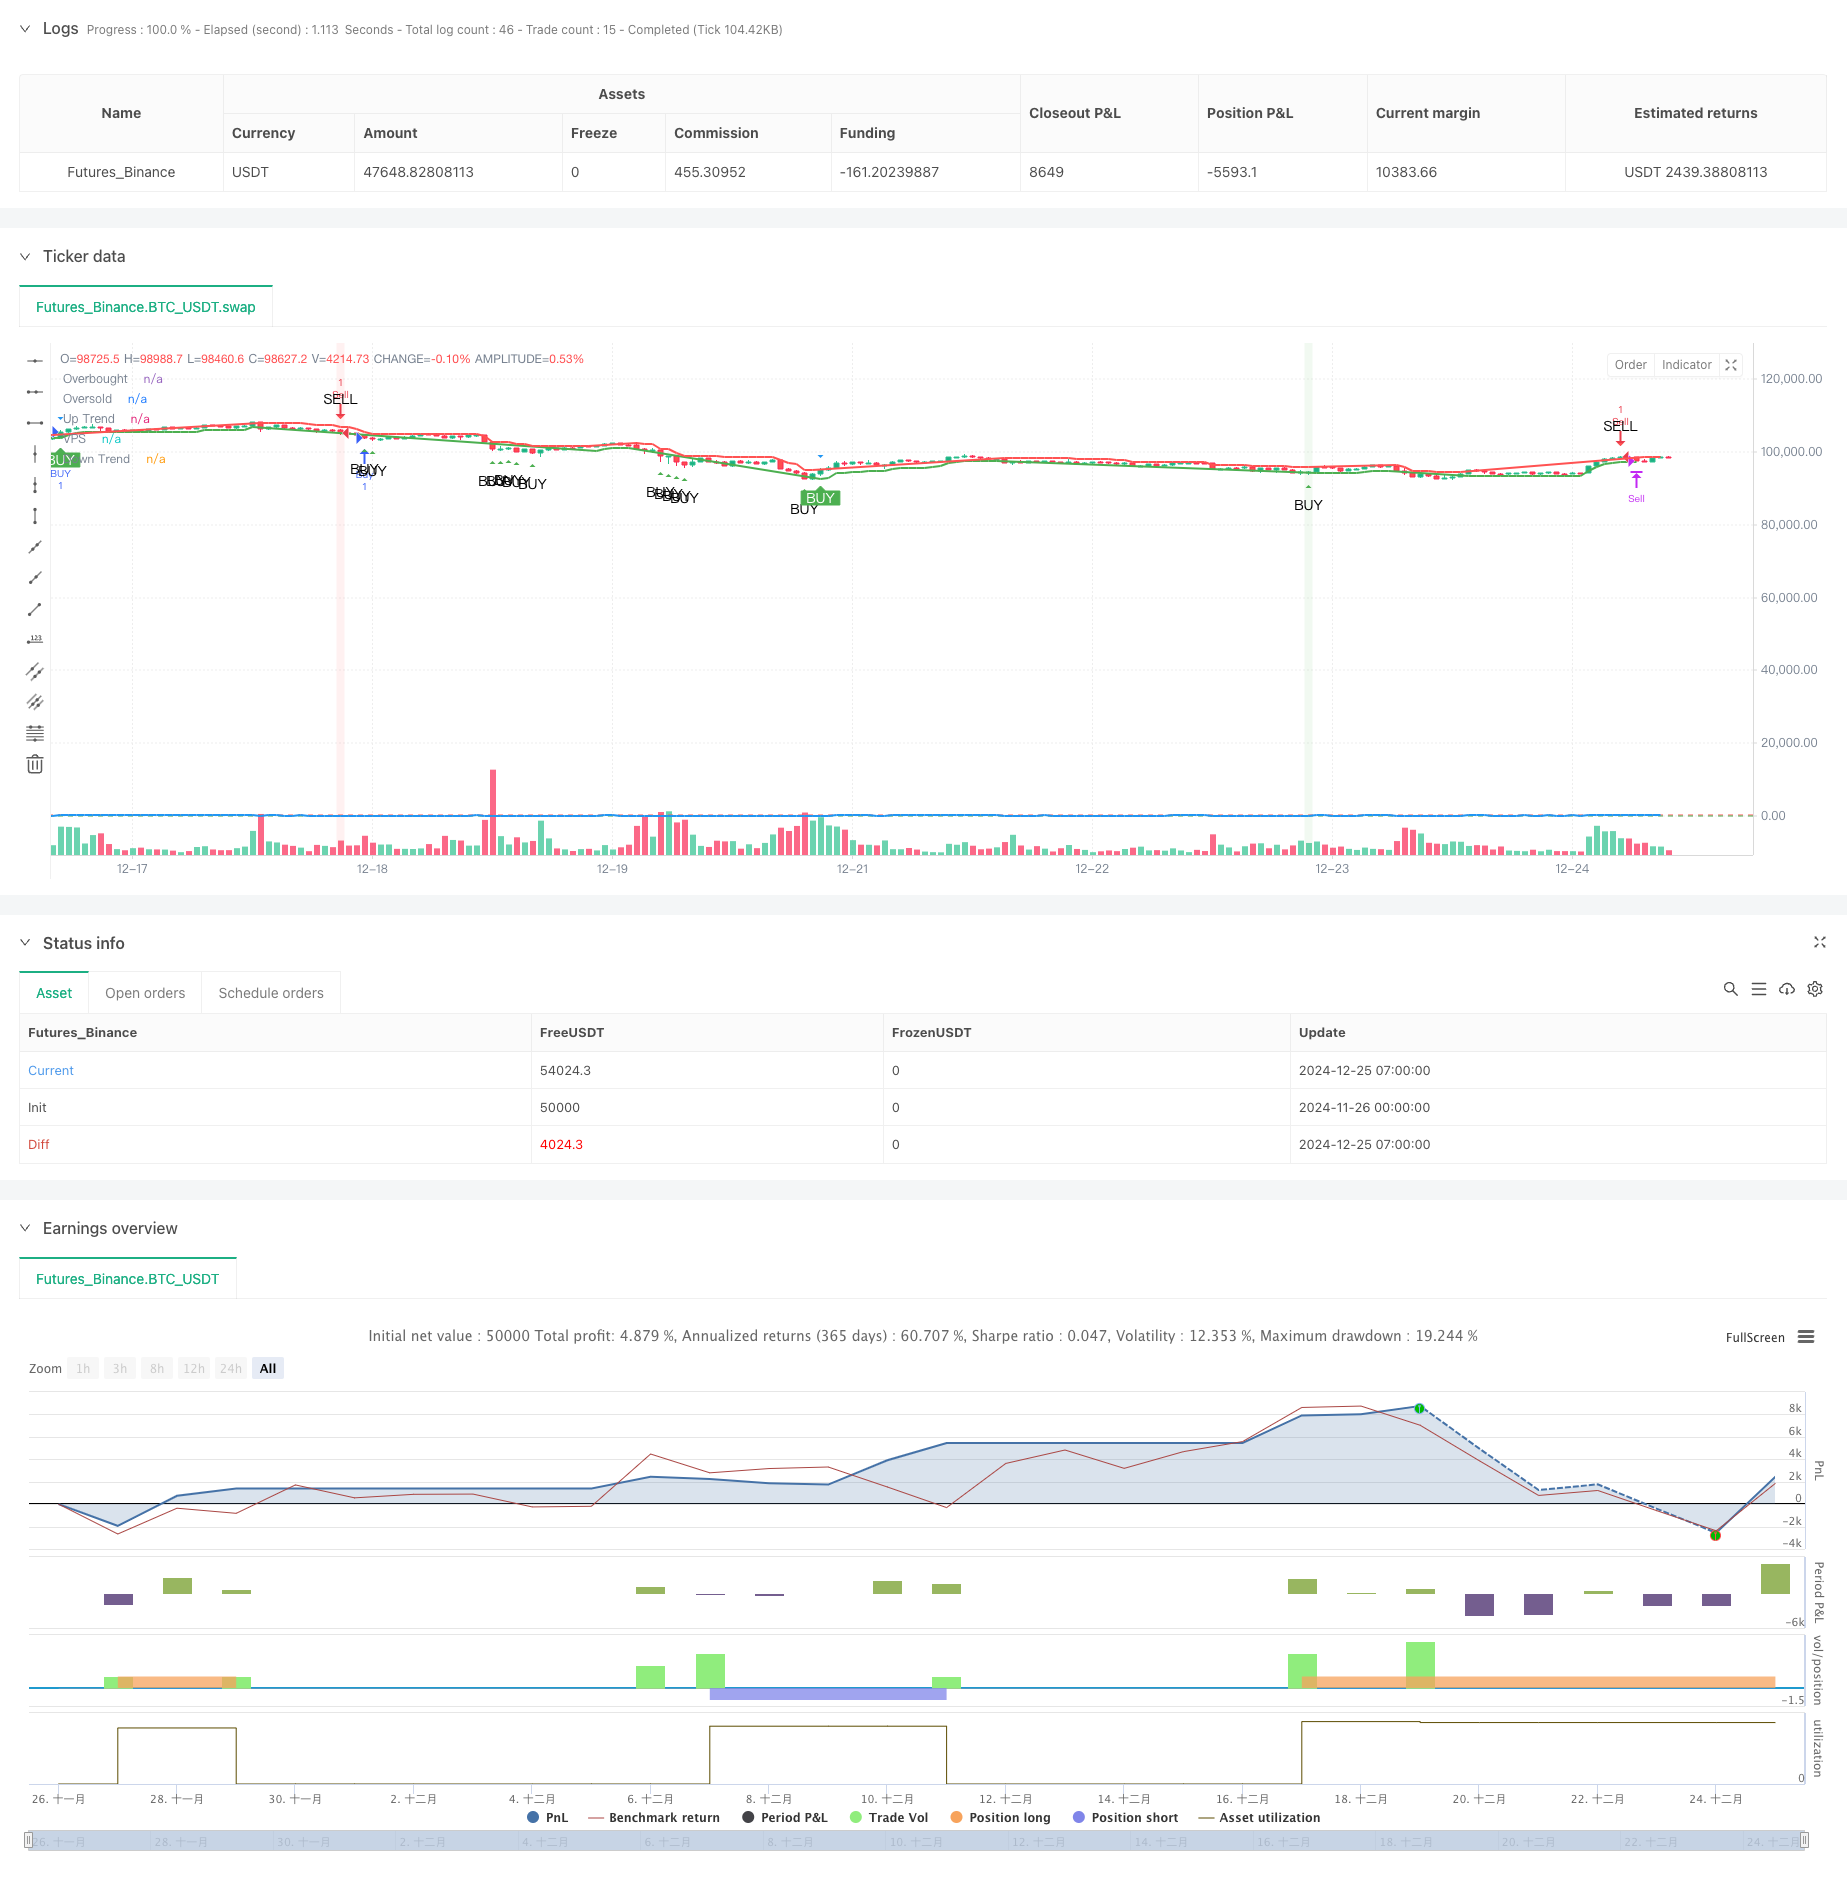
概述
该策略是一个结合了人工智能技术的高级趋势跟踪交易系统,主要整合了VPS(波动价格系统)背离指标和WOW趋势方法。它利用VPS来识别市场波动性和趋势强度,同时结合RSI背离来检测潜在的价格反转点。该策略能够为多空双向交易提供精确的入场信号,通过同时利用趋势动量和背离分析来增强市场预测的准确性。
策略原理
策略运作基于三个核心组件: 1. WOW趋势指标用于确认趋势变化(从多头转空头或反之) 2. VPS条件用于验证波动性和趋势强度 3. RSI背离分析用于识别潜在反转点
系统首先计算基于ATR的动态支撑阻力通道,结合VPS长度参数(默认11)来评估市场状态。当价格突破超买水平(78)或超卖水平(27)时,系统会触发交易信号。同时,策略还会监测价格与VPS指标之间的背离情况,用于进一步确认交易方向。
策略优势
- 多维度分析: 通过结合趋势跟踪、波动率和背离分析,提供更全面的市场视角
- 自适应性强: 使用动态的ATR通道,能够根据市场波动性自动调整
- 风险管理完善: 内置了止盈止损机制,可以根据预设的利润目标自动平仓
- 信号确认机制: 需要多个条件同时满足才会触发交易,降低虚假信号的可能性
- 双向交易能力: 可以捕捉多空双向的交易机会,充分利用市场波动
策略风险
- 市场噪音: 在横盘或低波动率环境下可能产生虚假信号
- 参数敏感性: 指标参数的设置(如VPS长度、超买超卖水平)对策略表现影响较大
- 滑点风险: 在短周期(如5分钟)交易中,可能面临较大的滑点影响
- 信号延迟: 多重确认机制可能导致入场时机相对滞后
- 资金管理: 固定资金分配方式可能在不同市场条件下表现不一
策略优化方向
- 动态参数调整: 可以引入自适应参数机制,根据市场状态动态调整VPS长度和超买超卖阈值
- 市场环境过滤: 添加市场环境识别模块,在不适合的市场条件下暂停交易
- 止损优化: 可以基于ATR设计更灵活的止损机制,提高风险控制的精确性
- 分时段优化: 针对不同交易时段的特点,调整策略参数和交易规则
- 资金管理优化: 引入动态仓位管理,根据市场波动性和盈亏状况调整交易规模
总结
这是一个融合了多种技术指标和分析方法的综合性交易策略。通过将人工智能技术与传统技术分析相结合,策略能够在保持稳健性的同时提供较高的交易准确率。策略的核心优势在于其多层面的信号确认机制和完善的风险管理体系,而主要的优化空间在于参数的动态调整和市场环境的识别。通过持续优化和改进,该策略有望在不同市场环境下都能保持稳定的表现。
策略源码
/*backtest
start: 2024-11-26 00:00:00
end: 2024-12-25 08:00:00
period: 1h
basePeriod: 1h
exchanges: [{"eid":"Futures_Binance","currency":"BTC_USDT"}]
*/

//@version=6
strategy("AI+VPS Vijay Prasad Strategy", overlay=true)

// --- VPS Divergence Strategy Inputs ---
vps_length = input.int(11, title="VPS Length")
vps_overbought = input.int(78, title="VPS Overbought Level")  // Overbought level for VPS
vps_oversold = input.int(27, title="VPS Oversold Level")  // Oversold level for VPS

// Calculate VPS (Relative Strength Index alternative) - here using a custom divergence condition
vps = ta.rsi(close, vps_length)

// Plot VPS on the chart
plot(vps, title="VPS", color=color.blue, linewidth=2)
hline(vps_overbought, "Overbought", color=color.red, linewidth=1)
hline(vps_oversold, "Oversold", color=color.green, linewidth=1)

// Define Buy and Sell Conditions based on Overbought/Oversold VPS
vps_buy_condition = vps < vps_oversold  // Buy signal when VPS is oversold
vps_sell_condition = vps > vps_overbought  // Sell signal when VPS is overbought

// Define Bullish and Bearish Divergence conditions
bullish_divergence = (low[1] < low[2] and vps[1] > vps[2] and low < low[1] and vps > vps[1])
bearish_divergence = (high[1] > high[2] and vps[1] < vps[2] and high > high[1] and vps < vps[1])

// Combine Buy and Sell signals:
// Buy when VPS is oversold or Bullish Divergence occurs
vps_buy_condition_final = vps_buy_condition or bullish_divergence
// Sell when VPS is overbought or Bearish Divergence occurs
vps_sell_condition_final = vps_sell_condition or bearish_divergence

// Plot Buy and Sell Signals
plotshape(series=vps_buy_condition_final, title="VPS Buy Signal", location=location.belowbar, color=color.green, style=shape.triangleup, text="BUY")
plotshape(series=vps_sell_condition_final, title="VPS Sell Signal", location=location.abovebar, color=color.red, style=shape.triangledown, text="SELL")

// VPS Divergence Highlight
bgcolor(bullish_divergence ? color.new(color.green, 90) : na)  // Highlight background for Bullish Divergence
bgcolor(bearish_divergence ? color.new(color.red, 90) : na)  // Highlight background for Bearish Divergence

// Strategy: Buy and Sell with target
if vps_buy_condition_final
    strategy.entry("Buy", strategy.long)

if vps_sell_condition_final
    strategy.entry("Sell", strategy.short)

// Capital settings for the strategy (for backtesting purposes)
capital_per_trade = input.float(1000, title="Capital per Trade (INR)", minval=1)
buy_target_inr = 1500  // Profit target for Buy in INR
sell_target_inr = 1000  // Profit target for Sell in INR

trade_value = close * (capital_per_trade / close)  // Value of one contract at current price

// Profit threshold calculation
buy_profit_target = buy_target_inr / trade_value  // Profit in price movement for Buy
sell_profit_target = sell_target_inr / trade_value  // Profit in price movement for Sell

// Exit based on profit targets
if strategy.position_size > 0
    profit_inr = (close - strategy.position_avg_price) * strategy.position_size
    if profit_inr >= buy_target_inr
        strategy.close("Buy", comment="Profit Target Reached")

if strategy.position_size < 0
    profit_inr = (strategy.position_avg_price - close) * -strategy.position_size
    if profit_inr >= sell_target_inr
        strategy.close("Sell", comment="Profit Target Reached")

// --- WoW Trends + VPS (Vijay Prasad Strategy) Logic ---
Periods = input.int(title="ATR Period", defval=10)
src = input.source(close, title="Source")
Multiplier = input.float(title="ATR Multiplier", step=0.1, defval=1.7)
changeATR = input.bool(title="Change ATR Calculation Method ?", defval=true)
showsignals = input.bool(title="Show Buy/Sell Signals ?", defval=true)

// --- ATR Calculation ---
atr2 = ta.sma(ta.tr, Periods)
atr = changeATR ? ta.atr(Periods) : atr2
up = src - (Multiplier * atr)
up1 = na(up[1]) ? up : up[1]
up := close[1] > up1 ? math.max(up, up1) : up
dn = src + (Multiplier * atr)
dn1 = na(dn[1]) ? dn : dn[1]
dn := close[1] < dn1 ? math.min(dn, dn1) : dn

// --- WoW Trends Logic ---
var trend = 1
trend := na(trend[1]) ? 1 : trend
trend := trend == -1 and close > dn1 ? 1 : trend == 1 and close < up1 ? -1 : trend

// --- VPS Logic (Vijay Prasad Strategy) ---
vpsVolatilityCondition = (high - low) > (1.5 * ta.sma(ta.tr, 20))  // VPS condition based on volatility
vpsTrendCondition = trend == 1  // VPS condition to check if trend is up
vpsSignal = vpsVolatilityCondition and vpsTrendCondition  // Combine both VPS conditions

// --- Buy/Sell Signal Logic ---
buySignal = trend == 1 and trend[1] == -1  // Signal to Buy (when trend switches to up)
sellSignal = trend == -1 and trend[1] == 1  // Signal to Sell (when trend switches to down)

// --- Combined Buy/Sell Signal Logic (WoW Trends + VPS) ---
combinedBuySignal = buySignal and vpsSignal
combinedSellSignal = sellSignal and vpsSignal

// --- Plot WoW Trends Lines using plot() ---
plot(trend == 1 ? up : na, title="Up Trend", color=color.green, linewidth=2)
plot(trend == -1 ? dn : na, title="Down Trend", color=color.red, linewidth=2)

// --- Plot VPS Signals ---
plotshape(vpsSignal and showsignals, title="VPS Signal", text="VPS", location=location.abovebar, style=shape.triangledown, size=size.small, color=color.blue, textcolor=color.white)

// --- Plot Combined Buy/Sell Signals ---
plotshape(combinedBuySignal and showsignals, title="Combined Buy Signal", text="BUY", location=location.belowbar, style=shape.labelup, size=size.small, color=color.green, textcolor=color.white)
plotshape(combinedSellSignal and showsignals, title="Combined Sell Signal", text="SELL", location=location.abovebar, style=shape.labeldown, size=size.small, color=color.red, textcolor=color.white)

// --- Strategy Entries ---
if (combinedBuySignal)
    strategy.entry("BUY", strategy.long)

if (combinedSellSignal)
    strategy.entry("SELL", strategy.short)

// --- Highlight Bars for Buy/Sell Signals ---
barcolor(combinedBuySignal ? color.green : na, offset=-1)
barcolor(combinedSellSignal ? color.red : na, offset=-1)
相关推荐