
Overview
This strategy is a comprehensive trading system that combines multiple technical indicators with ICT (Institutional Trading Concepts). It integrates traditional technical analysis indicators (RSI, Stochastic, MACD, EMA) with modern ICT trading concepts (Fair Value Gap, Break of Structure, Higher Timeframe Bias Analysis) across different timeframes, implementing precise market entry control through strict trading session filtering.
Strategy Principles
The strategy operates based on five core components working in synergy:
- Higher Timeframe Bias Analysis: Using 200 EMA to determine market trend direction on higher timeframes
- Trading Session Filter: Trading restricted to specific "Kill Zone" (07:00-10:00)
- Fair Value Gap (FVG) Identification: Recognizing market structural gaps through three-candle patterns
- Break of Structure (BOS) Determination: Confirming directional changes based on key price levels
- Lower Timeframe Indicator Confirmation: Multiple verification using RSI, Stochastic, MACD, and 200 EMA
Strategy Advantages
- Multi-dimensional Signal Integration: Enhances signal reliability through combination of multiple independent technical indicators and ICT concepts
- Timeframe Synergy: Higher and lower timeframe coordination improves signal stability
- Structural Opportunity Capture: Focuses on high-probability structural trading opportunities through FVG and BOS identification
- Comprehensive Risk Control: Includes stop-loss and take-profit mechanisms, standardized money management
- Trading Time Optimization: Reduces interference from non-trading sessions through time filtering
Strategy Risks
- Signal Lag: Multiple indicator combination may lead to delayed entry timing
- Sideways Market Performance: May generate frequent false signals in ranging markets
- Parameter Sensitivity: Multiple indicator parameters require thorough historical data validation
- Execution Risk: Complex condition combinations may miss some trading opportunities in live trading
- Market Environment Dependency: Strategy performance may vary significantly across different market conditions
Strategy Optimization Directions
- Dynamic Parameter Adjustment: Adaptive adjustment of indicator parameters based on market volatility
- Market Environment Classification: Adding market environment recognition module for different parameter combinations
- Signal Weight Optimization: Introducing machine learning methods to optimize indicator weight distribution
- Timeframe Extension: Including more timeframe analyses to improve signal reliability
- Risk Control Enhancement: Introducing dynamic stop-loss mechanisms and optimizing money management strategies
Summary
The strategy constructs a comprehensive trading system by integrating traditional technical analysis with modern ICT concepts. Its strengths lie in multi-dimensional signal confirmation and strict risk control, while facing challenges in parameter optimization and market adaptability. Through continuous optimization and improvement, the strategy shows promise in maintaining stable performance across different market environments.
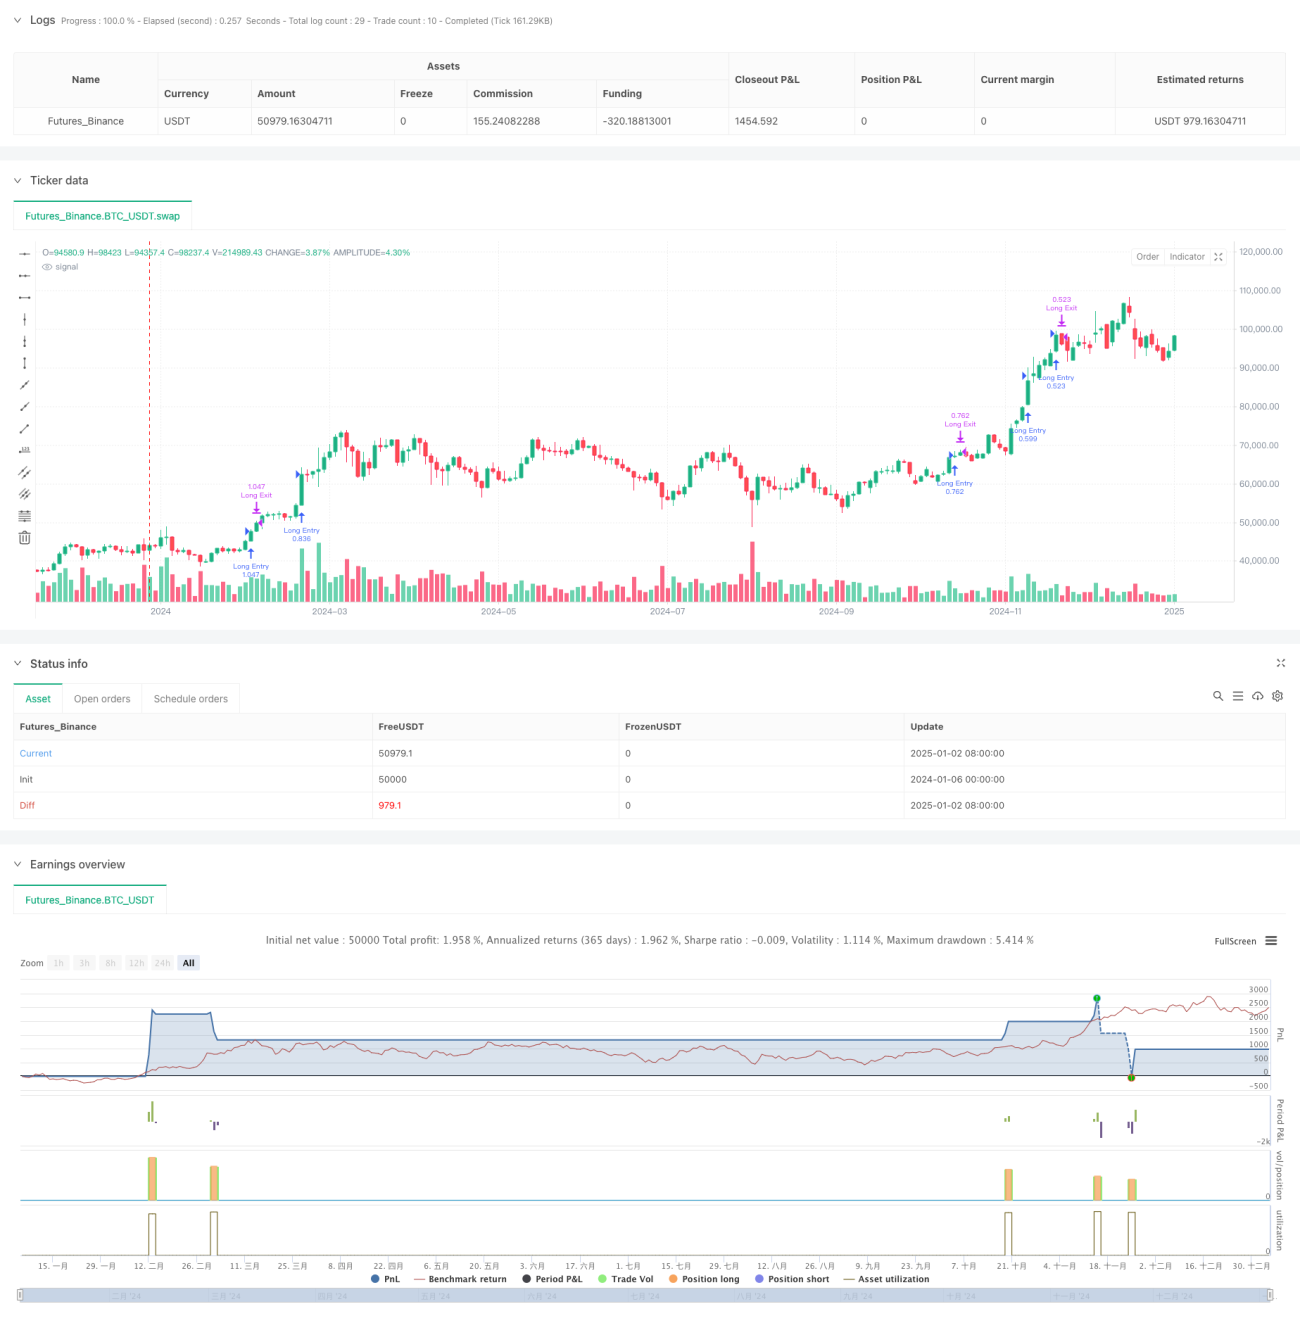
/*backtest
start: 2024-01-06 00:00:00
end: 2025-01-04 08:00:00
period: 2d
basePeriod: 2d
exchanges: [{"eid":"Futures_Binance","currency":"BTC_USDT"}]
*/

// -----------------------------------------------------
// Multi-Signal Conservative Strategy (Pine Script v5)
// + More ICT Concepts (HTF Bias, FVG, Killzone, BOS)
// ------------------------------------------------------ 1