
概述
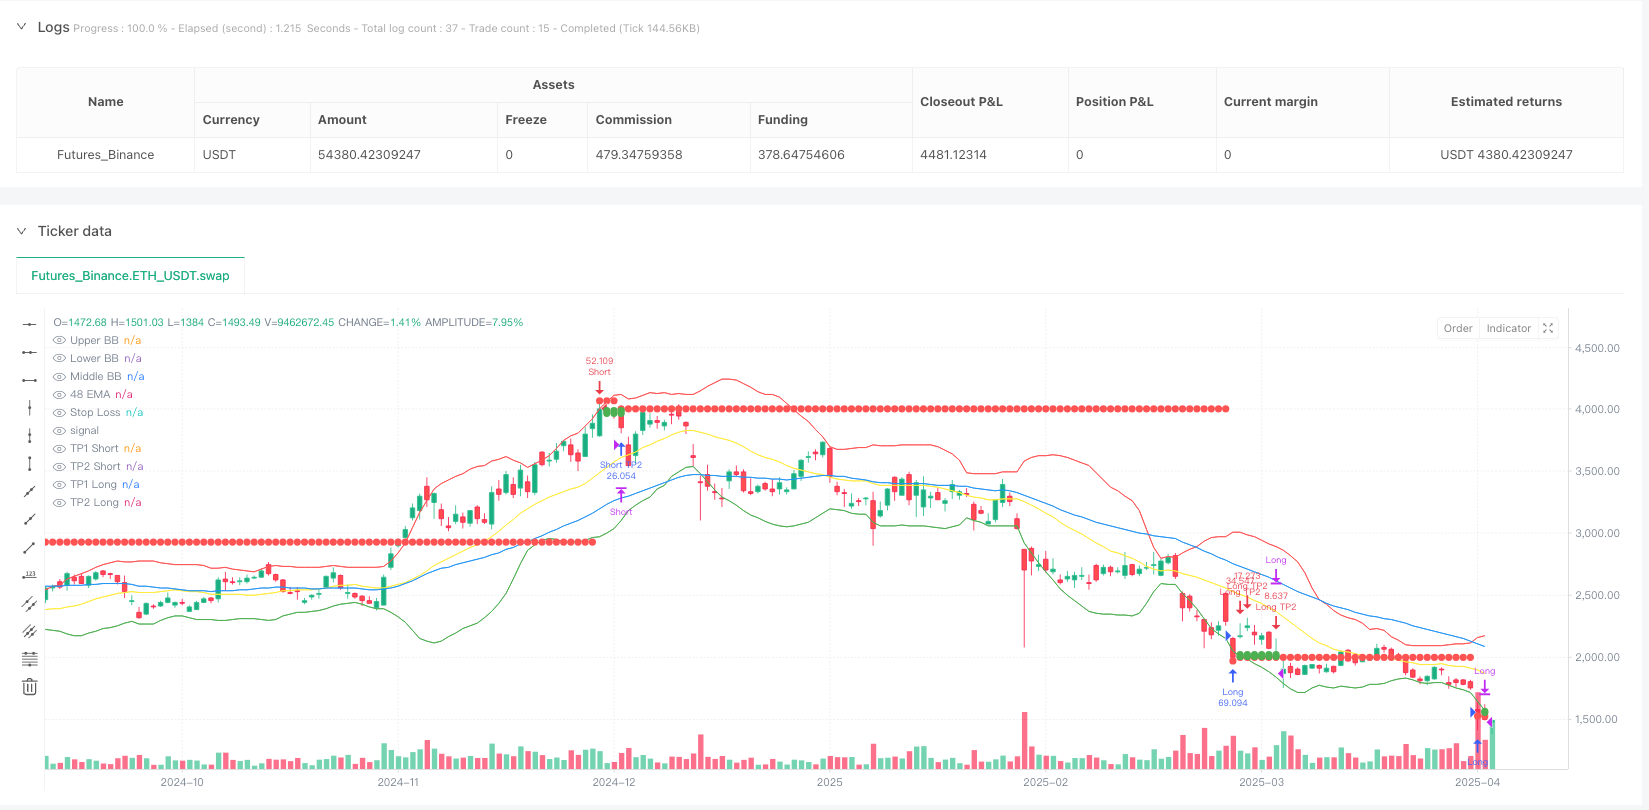
多指标确认均线突破DCA动态止盈策略是一种高级短线交易系统,结合了技术分析与美元成本平均法(DCA)。该策略使用EMA 48、RSI 14、MACD和布林带等多个技术指标来确认潜在的入场点,同时实施了结构化的仓位管理方法和预设的风险控制机制。策略核心是识别价格与EMA的交叉点,并使用RSI、MACD和布林带进行确认,结合高时间框架分析避免假信号,采用三级DCA策略进行加仓,并通过多层次止盈和动态止损保护利润。
策略原理
该策略的原理基于多重技术指标的组合确认,主要包括以下关键组件:
入场条件系统:
- 价格必须穿越48周期EMA,多头时要向上穿越,空头时要向下穿越
- RSI必须确认方向强度(多头时>60,空头时<40)
- MACD线必须穿越信号线,确认动量方向
- 价格必须接近之前的支撑/阻力区域
- RSI在第5个峰/谷显示背离信号
- 高时间框架确认这是第二个支点位置
动态仓位管理:
- 初始风险限制在账户的1-3%
- 仓位规模遵循1-2-6的DCA比例进行加仓
- 首次止损设置在入场点的1-3%位置,以货币金额计算
- 全部DCA部署后,止损更新至入场点的1.3%位置
智能获利机制:
- 当价格达到0.5%利润时,关闭25%仓位
- 当价格达到1%利润时,关闭50%仓位
- 第二次获利后,止损移动至保本位置
代码深度分析显示,该策略还包含智能峰谷识别系统,通过跟踪价格和RSI的最近5个波动点来检测背离模式。高时间框架确认系统则通过分析日线图上的支撑和阻力位来避免低时间框架上的假信号。
策略优势
深入剖析该策略的代码,我们可以总结出以下显著优势:
多层次确认系统:通过多个技术指标的协同作用,大大降低了假信号的可能性,提高了交易胜率。EMA、RSI、MACD和布林带的组合使用确保了入场点的高质量。
智能资金管理:采用1-2-6 DCA比例的方法既能利用市场波动性平均成本,又能限制总体风险敞口。初始风险仅限于账户的1-3%,确保了即使在最坏情况下也不会造成灾难性损失。
动态止损保护:止损机制随着交易的发展而调整,特别是在获取部分利润后将止损移至保本位置,这有效平衡了保护利润和允许交易呼吸空间的需求。
阶段性获利策略:通过在0.5%和1%利润点分别关闭25%和50%的仓位,策略能够锁定部分利润,同时保留仓位以捕捉更大的市场移动,实现风险与回报的均衡。
高时间框架确认:使用更高时间框架的支撑和阻力位来过滤交易信号,减少了低时间框架上常见的噪声和假突破的影响。
策略风险
尽管该策略设计精密,但仍存在几个需要注意的风险因素:
参数敏感性:策略的表现高度依赖于多个参数设置,包括EMA周期、RSI阈值和DCA水平。这些参数的微小变化可能导致交易结果的显著差异,需要仔细优化和回测。
巨大波动的风险:尽管有DCA机制,在市场发生剧烈波动时,价格可能迅速超过所有设定的止损点,导致实际损失超过预期。对于这种风险,可以考虑使用更严格的初始仓位大小或在高波动期间暂停交易。
连续亏损的叠加效应:即使单个交易的风险有限,连续亏损仍可能导致资金曲线的显著下降。建议实施额外的整体风险控制,如每日或每周最大损失限制。
RSI背离识别的复杂性:代码中RSI背离的检测依赖于历史数据的准确性,在某些市场条件下可能不够可靠。可以考虑使用更先进的统计方法来确认背离信号。
依赖市场流动性:在流动性较低的市场中,大量的DCA订单可能面临滑点问题,影响策略的整体效率。应该限制在高流动性市场中使用此策略。
策略优化方向
基于对代码的深入分析,以下是该策略可以优化的几个方向:
动态参数调整:可以引入基于市场波动性的动态参数调整机制。例如,在高波动期间自动增加RSI的阈值要求,或调整EMA长度以适应不同的市场周期。这样的自适应机制可以提高策略在不同市场环境中的稳健性。
增强背离检测:当前的RSI背离检测相对简单,可以通过引入更复杂的算法来提高准确性,如使用Fisher转换RSI或添加成交量确认。这将减少误报信号,提高策略的准确性。
智能获利优化:目前的固定获利点可以改进为基于市场波动性的动态获利点。例如,在高波动期间设置更高的获利目标,而在低波动期间降低目标,以适应市场条件的变化。
资金管理细化:可以优化DCA的比例和触发点,根据市场结构和当前趋势强度动态调整。例如,在强趋势中采用更激进的DCA比例,而在弱趋势中更为保守。
交易时间优化:引入基于交易量和波动性的时间过滤器,避免在低活跃度时段交易。这可以通过分析历史数据,确定最佳交易时间窗口来实现。
总结
多指标确认均线突破DCA动态止盈策略是一个设计精良的短线交易系统,它巧妙地结合了多个技术分析工具与先进的资金管理技术。通过EMA、RSI、MACD和布林带等指标的协同工作,该策略能够识别高概率的入场点,同时使用结构化的DCA方法和动态止损/止盈机制来管理风险和锁定利润。
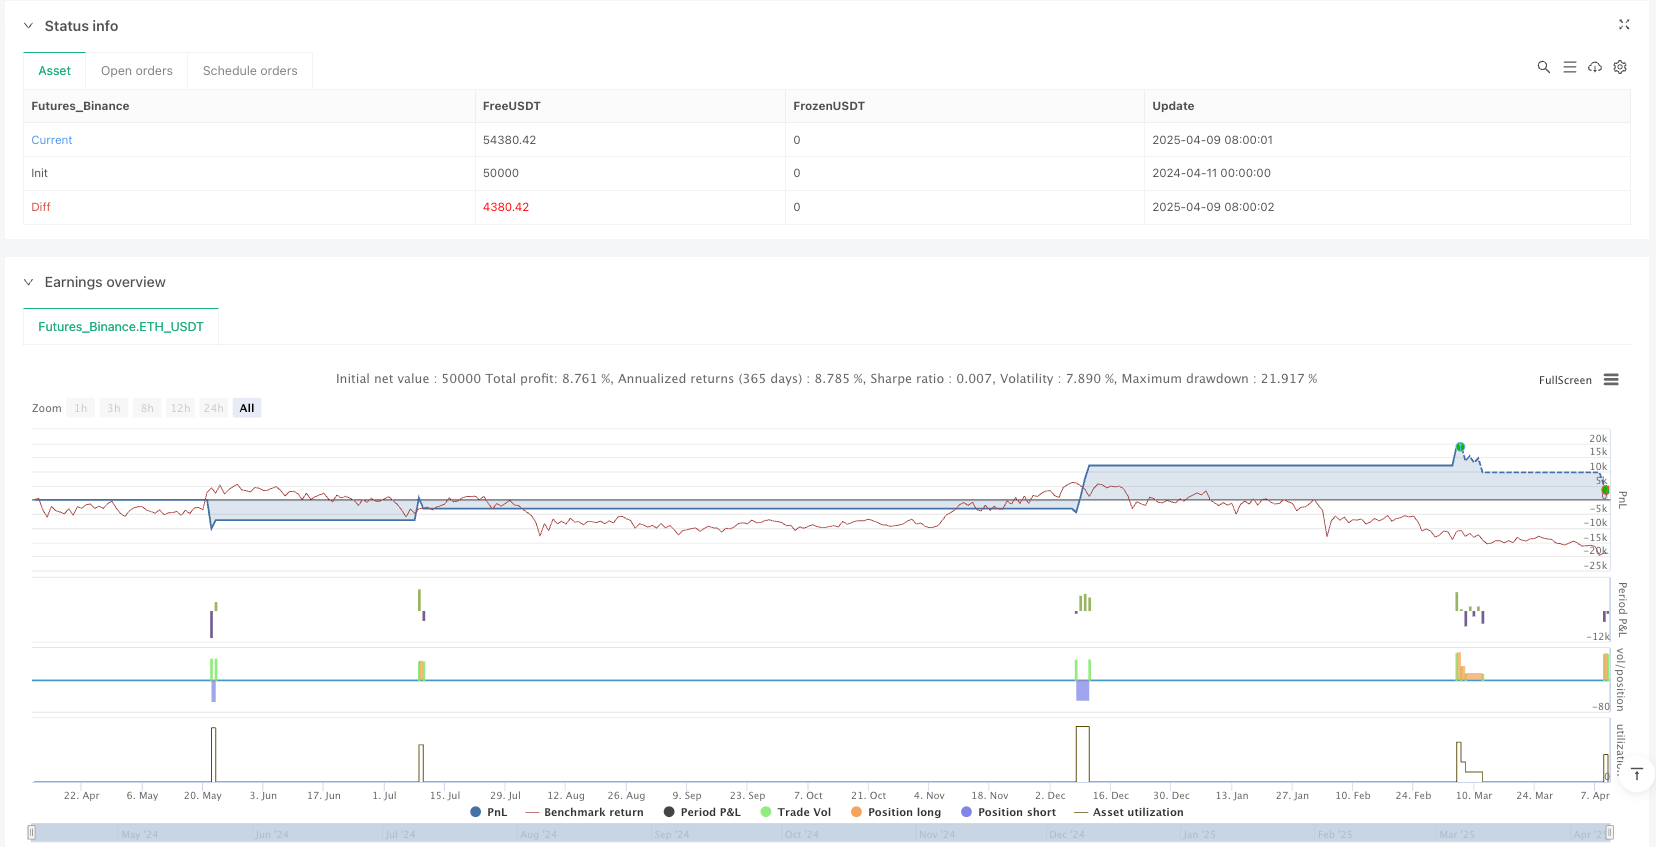
虽然该策略具有明显的优势,包括严格的风险控制、多层次确认系统和智能获利机制,但用户仍需警惕参数敏感性和市场剧烈波动带来的风险。通过实施建议的优化措施,如动态参数调整、增强背离检测和智能获利优化,该策略的稳健性和盈利能力有望进一步提高。
对于交易者而言,该策略最适合应用于具有足够流动性的市场,并且在使用前应进行充分的历史回测和参数优化。通过谨慎的实施和持续的监控调整,这个多层次的交易系统可以成为短线交易者工具箱中的有力武器。
/*backtest
start: 2024-04-11 00:00:00
end: 2025-04-10 00:00:00
period: 1d
basePeriod: 1d
exchanges: [{"eid":"Futures_Binance","currency":"ETH_USDT"}]
*/

//@version=6
strategy("Scalping Strategy with DCA - V2", overlay=true, margin_long=100, margin_short=100)

// Input parameters
emaLength = input.int(48, title="EMA Length", minval=1, group="Main Indicators")
rsiLength = input.int(14, title="RSI Length", minval=1, group="Main Indicators")
macdShortLength = input.int(12, title="MACD Short Length", minval=1, group="Main Indicators")
macdLongLength = input.int(30, title="MACD Long Length", minval=1, group="Main Indicators")
macdSignalLength = input.int(9, title="MACD Signal Length", minval=1, group="Main Indicators")
bbLength = input.int(20, title="Bollinger Bands Length", group="Main Indicators")
bbMult = input.float(2.0, title="Bollinger Bands Multiplier", group="Main Indicators")

// Risk management parameters
initialRiskPercent = input.float(1.0, title="Initial Risk % of Account", minval=0.1, maxval=3.0, step=0.1, group="Risk Management")
stopLossPercent = input.float(1.5, title="Stop Loss % (Unboosted)", minval=0.5, maxval=3.0, step=0.1, group="Risk Management")
fixedSLPercent = input.float(1.3, title="Fixed SL % after full DCA", minval=0.1, maxval=5.0, step=0.1, group="Risk Management")
takeProfitPercent1 = input.float(0.5, title="First Take Profit % (25% Volume)", minval=0.1, group="Risk Management")
takeProfitPercent2 = input.float(1.0, title="Second Take Profit % (50% Volume)", minval=0.1, group="Risk Management")

// DCA parameters
enableDCA = input.bool(true, title="Enable DCA", group="DCA Settings")
dcaLevel1 = input.float(1.0, title="DCA Level 1 % Drop", minval=0.1, group="DCA Settings")
dcaLevel2 = input.float(2.0, title="DCA Level 2 % Drop", minval=0.1, group="DCA Settings")

// Higher Timeframe parameters
higherTF = input.timeframe("D", title="Higher Timeframe for Confirmation", group="Advanced Settings")
useHTFConfirmation = input.bool(true, title="Use Higher Timeframe Confirmation", group="Advanced Settings")

// Debug parameters
showLabels = input.bool(true, title="Show Entry/Exit Labels", group="Visual")
showSL = input.bool(true, title="Show Stop Loss Lines", group="Visual")
showTP = input.bool(true, title="Show Take Profit Lines", group="Visual")

// Calculate indicators
ema = ta.ema(close, emaLength)
rsi = ta.rsi(close, rsiLength)
[macdLine, signalLine, _] = ta.macd(close, macdShortLength, macdLongLength, macdSignalLength)
[middle, upper, lower] = ta.bb(close, bbLength, bbMult)

// Variables for tracking peaks and troughs
var priceHighs = array.new_float(0)
var priceLows = array.new_float(0)
var rsiHighs = array.new_float(0)
var rsiLows = array.new_float(0)

// Track last 5 peaks and troughs for both price and RSI
pivot_high = ta.pivothigh(high, 2, 2)
if not na(pivot_high)
    array.push(priceHighs, pivot_high)
    if array.size(priceHighs) > 5
        array.shift(priceHighs)

pivot_low = ta.pivotlow(low, 2, 2)
if not na(pivot_low)
    array.push(priceLows, pivot_low)
    if array.size(priceLows) > 5
        array.shift(priceLows)

rsi_pivot_high = ta.pivothigh(rsi, 2, 2)
if not na(rsi_pivot_high)
    array.push(rsiHighs, rsi_pivot_high)
    if array.size(rsiHighs) > 5
        array.shift(rsiHighs)

rsi_pivot_low = ta.pivotlow(rsi, 2, 2)
if not na(rsi_pivot_low)
    array.push(rsiLows, rsi_pivot_low)
    if array.size(rsiLows) > 5
        array.shift(rsiLows)

// Check for RSI divergence
rsiDivergenceBullish = array.size(priceLows) >= 5 and array.size(rsiLows) >= 5 and array.get(priceLows, array.size(priceLows) - 1) < array.get(priceLows, array.size(priceLows) - 5) and array.get(rsiLows, array.size(rsiLows) - 1) > array.get(rsiLows, array.size(rsiLows) - 5)

rsiDivergenceBearish = array.size(priceHighs) >= 5 and array.size(rsiHighs) >= 5 and array.get(priceHighs, array.size(priceHighs) - 1) > array.get(priceHighs, array.size(priceHighs) - 5) and array.get(rsiHighs, array.size(rsiHighs) - 1) < array.get(rsiHighs, array.size(rsiHighs) - 5)

// Check if price is near previous high/low (Rule #4)
isNearPrevHigh = array.size(priceHighs) >= 2 and math.abs(high - array.get(priceHighs, array.size(priceHighs) - 2)) / array.get(priceHighs, array.size(priceHighs) - 2) < 0.01
isNearPrevLow = array.size(priceLows) >= 2 and math.abs(low - array.get(priceLows, array.size(priceLows) - 2)) / array.get(priceLows, array.size(priceLows) - 2) < 0.01

// Higher timeframe confirmation (Rule #10)
// Get pivot points from higher timeframe
htf_is_pivot_low = request.security(syminfo.tickerid, higherTF, not na(ta.pivotlow(low, 2, 2)), barmerge.gaps_off, barmerge.lookahead_off)
htf_is_pivot_high = request.security(syminfo.tickerid, higherTF, not na(ta.pivothigh(high, 2, 2)), barmerge.gaps_off, barmerge.lookahead_off)

// Count pivots in higher timeframe to check if this is the 2nd pivot
var htf_pivot_low_count = 0
var htf_pivot_high_count = 0

if htf_is_pivot_low
    htf_pivot_low_count := htf_pivot_low_count + 1
    htf_pivot_low_count := math.min(htf_pivot_low_count, 10)  // Prevent unlimited counting

if htf_is_pivot_high
    htf_pivot_high_count := htf_pivot_high_count + 1
    htf_pivot_high_count := math.min(htf_pivot_high_count, 10)  // Prevent unlimited counting

// Reset counts after a while to maintain relevance
if not htf_is_pivot_low and not htf_is_pivot_high and bar_index % 100 == 0
    htf_pivot_low_count := 0
    htf_pivot_high_count := 0

// Check if this is the 2nd pivot in higher timeframe
isHTFSecondPivotLow = htf_is_pivot_low and htf_pivot_low_count == 2
isHTFSecondPivotHigh = htf_is_pivot_high and htf_pivot_high_count == 2

// Check crossing of Bollinger Bands
crossUpperBand = ta.crossover(close, upper)
crossLowerBand = ta.crossunder(close, lower)

// Entry conditions refined with higher timeframe confirmation
longCondition = close > ema and close[1] <= ema[1] and rsi > 60 and macdLine > signalLine and isNearPrevLow and rsiDivergenceBullish and (not useHTFConfirmation or isHTFSecondPivotLow)
shortCondition = close < ema and close[1] >= ema[1] and rsi < 40 and macdLine < signalLine and isNearPrevHigh and rsiDivergenceBearish and (not useHTFConfirmation or isHTFSecondPivotHigh)

// Additional entry conditions when price crosses Bollinger Bands (Rule #11)
longBBCondition = crossLowerBand and rsi < 30
shortBBCondition = crossUpperBand and rsi > 70

// Calculate position sizes for DCA
initialSize = strategy.equity * initialRiskPercent / 100 / 9  // Initial sizing according to the 1-2-6 rule
dca1Size = initialSize * 2
dca2Size = initialSize * 6

// Calculate SL in money terms (Rule #3)
slMoneyAmount = strategy.equity * initialRiskPercent / 100 * stopLossPercent / 100

// Variables to track DCA levels
var float longEntryPrice = 0.0
var float shortEntryPrice = 0.0
var int longDCACount = 0
var int shortDCACount = 0
var float stopLossLevel = 0.0
var float takeProfit1Level = 0.0
var float takeProfit2Level = 0.0
var float slMoneyValue = 0.0

// Close partial positions at take profit levels
if strategy.position_size > 0
    if close >= takeProfit1Level and takeProfit1Level > 0 and strategy.position_size == initialSize + (longDCACount > 0 ? dca1Size : 0) + (longDCACount > 1 ? dca2Size : 0)
        strategy.order("Long TP1", strategy.short, qty=strategy.position_size * 0.25)
        if showLabels
            label.new(bar_index, high, "TP1 (25%)", color=color.green, textcolor=color.white, style=label.style_label_down)

    if close >= takeProfit2Level and takeProfit2Level > 0 and strategy.position_size > initialSize * 0.25
        strategy.order("Long TP2", strategy.short, qty=strategy.position_size * 0.5)
        stopLossLevel := longEntryPrice  // Move SL to breakeven after TP2
        if showLabels
            label.new(bar_index, high, "TP2 (50%) & SL→BE", color=color.green, textcolor=color.white, style=label.style_label_down)

if strategy.position_size < 0
    if close <= takeProfit1Level and takeProfit1Level > 0 and math.abs(strategy.position_size) == initialSize + (shortDCACount > 0 ? dca1Size : 0) + (shortDCACount > 1 ? dca2Size : 0)
        strategy.order("Short TP1", strategy.long, qty=math.abs(strategy.position_size) * 0.25)
        if showLabels
            label.new(bar_index, low, "TP1 (25%)", color=color.red, textcolor=color.white, style=label.style_label_up)

    if close <= takeProfit2Level and takeProfit2Level > 0 and math.abs(strategy.position_size) > initialSize * 0.25
        strategy.order("Short TP2", strategy.long, qty=math.abs(strategy.position_size) * 0.5)
        stopLossLevel := shortEntryPrice  // Move SL to breakeven after TP2
        if showLabels
            label.new(bar_index, low, "TP2 (50%) & SL→BE", color=color.red, textcolor=color.white, style=label.style_label_up)

// DCA Logic
if enableDCA and strategy.position_size > 0 and longDCACount < 2
    if close < longEntryPrice * (1 - dcaLevel1/100) and longDCACount == 0
        strategy.entry("Long DCA1", strategy.long, qty=dca1Size)
        longDCACount := 1
        if showLabels
            label.new(bar_index, low, "DCA1", color=color.blue, textcolor=color.white, style=label.style_label_up)

    if close < longEntryPrice * (1 - dcaLevel2/100) and longDCACount == 1
        strategy.entry("Long DCA2", strategy.long, qty=dca2Size)
        longDCACount := 2
        // Update SL to fixed percentage after full DCA (Rule #6)
        stopLossLevel := longEntryPrice * (1 - fixedSLPercent/100)
        if showLabels
            label.new(bar_index, low, "DCA2 & SL Update", color=color.blue, textcolor=color.white, style=label.style_label_up)

if enableDCA and strategy.position_size < 0 and shortDCACount < 2
    if close > shortEntryPrice * (1 + dcaLevel1/100) and shortDCACount == 0
        strategy.entry("Short DCA1", strategy.short, qty=dca1Size)
        shortDCACount := 1
        if showLabels
            label.new(bar_index, high, "DCA1", color=color.purple, textcolor=color.white, style=label.style_label_down)

    if close > shortEntryPrice * (1 + dcaLevel2/100) and shortDCACount == 1
        strategy.entry("Short DCA2", strategy.short, qty=dca2Size)
        shortDCACount := 2
        // Update SL to fixed percentage after full DCA (Rule #6)
        stopLossLevel := shortEntryPrice * (1 + fixedSLPercent/100)
        if showLabels
            label.new(bar_index, high, "DCA2 & SL Update", color=color.purple, textcolor=color.white, style=label.style_label_down)

// Entry with initial position
if longCondition or longBBCondition
    strategy.close("Short")
    strategy.entry("Long", strategy.long, qty=initialSize)
    longEntryPrice := close
    longDCACount := 0
    shortDCACount := 0

    // Set SL based on money value (not percentage)
    slMoneyValue := slMoneyAmount
    // Convert to price level - simplified version
    stopLossLevel := close * (1 - stopLossPercent/100)

    takeProfit1Level := close * (1 + takeProfitPercent1/100)
    takeProfit2Level := close * (1 + takeProfitPercent2/100)
    if showLabels
        label.new(bar_index, low, "LONG", color=color.green, textcolor=color.white, style=label.style_label_up)

if shortCondition or shortBBCondition
    strategy.close("Long")
    strategy.entry("Short", strategy.short, qty=initialSize)
    shortEntryPrice := close
    longDCACount := 0
    shortDCACount := 0

    // Set SL based on money value (not percentage)
    slMoneyValue := slMoneyAmount
    // Convert to price level - simplified version
    stopLossLevel := close * (1 + stopLossPercent/100)

    takeProfit1Level := close * (1 - takeProfitPercent1/100)
    takeProfit2Level := close * (1 - takeProfitPercent2/100)
    if showLabels
        label.new(bar_index, high, "SHORT", color=color.red, textcolor=color.white, style=label.style_label_down)

// Stop Loss
if strategy.position_size > 0 and low <= stopLossLevel
    strategy.close("Long")
    if showLabels
        label.new(bar_index, low, "SL", color=color.red, textcolor=color.white, style=label.style_label_up)

if strategy.position_size < 0 and high >= stopLossLevel
    strategy.close("Short")
    if showLabels
        label.new(bar_index, high, "SL", color=color.red, textcolor=color.white, style=label.style_label_down)

// Market cap and holder % check can't be done directly in TradingView, but we display a reminder
if strategy.position_size != 0 and bar_index % 100 == 0
    label.new(bar_index, close, "Remember: Only trade coins with large market cap and >7% holder ratio",
              color=color.yellow, textcolor=color.black, style=label.style_label_left)

// Plot indicators - these must be at the global scope in Pine Script v6
plot(ema, color=color.blue, title="48 EMA")
plot(upper, color=color.red, title="Upper BB")
plot(lower, color=color.green, title="Lower BB")
plot(middle, color=color.yellow, title="Middle BB")

// Plot stop loss and take profit levels - conditions need to be part of the plot function in v6
plotSL = showSL and stopLossLevel > 0 ? stopLossLevel : na
plot(plotSL, color=color.red, style=plot.style_circles, linewidth=2, title="Stop Loss")

// TP for long positions
plotTP1Long = showTP and strategy.position_size > 0 and takeProfit1Level > 0 ? takeProfit1Level : na
plot(plotTP1Long, color=color.green, style=plot.style_circles, linewidth=1, title="TP1 Long")

plotTP2Long = showTP and strategy.position_size > 0 and takeProfit2Level > 0 ? takeProfit2Level : na
plot(plotTP2Long, color=color.green, style=plot.style_circles, linewidth=2, title="TP2 Long")

// TP for short positions
plotTP1Short = showTP and strategy.position_size < 0 and takeProfit1Level > 0 ? takeProfit1Level : na
plot(plotTP1Short, color=color.green, style=plot.style_circles, linewidth=1, title="TP1 Short")

plotTP2Short = showTP and strategy.position_size < 0 and takeProfit2Level > 0 ? takeProfit2Level : na
plot(plotTP2Short, color=color.green, style=plot.style_circles, linewidth=2, title="TP2 Short")

// Additional table with strategy information
if barstate.islastconfirmedhistory
    var table infoTable = table.new(position=position.top_right, columns=2, rows=5, bgcolor=color.new(color.black, 70), frame_width=1)

    table.cell(infoTable, 0, 0, "Strategy:", bgcolor=color.new(color.blue, 90), text_color=color.white)
    table.cell(infoTable, 1, 0, "Scalping with DCA", text_color=color.white)

    table.cell(infoTable, 0, 1, "Initial Risk:", bgcolor=color.new(color.blue, 90), text_color=color.white)
    table.cell(infoTable, 1, 1, str.tostring(initialRiskPercent, "#.##") + "% of account", text_color=color.white)

    table.cell(infoTable, 0, 2, "DCA Ratio:", bgcolor=color.new(color.blue, 90), text_color=color.white)
    table.cell(infoTable, 1, 2, "1-2-6", text_color=color.white)

    table.cell(infoTable, 0, 3, "SL After DCA:", bgcolor=color.new(color.blue, 90), text_color=color.white)
    table.cell(infoTable, 1, 3, str.tostring(fixedSLPercent, "#.##") + "%", text_color=color.white)

    table.cell(infoTable, 0, 4, "REMINDERS:", bgcolor=color.new(color.red, 90), text_color=color.white)
    table.cell(infoTable, 1, 4, "Only trade coins with market cap and >7% holder ratio", text_color=color.white)