
这不是普通的DCA策略,而是一个会思考的交易机器人
看了上千个Pine Script代码,这个"Master Trading Bot"确实有两把刷子。作者把DCA(定投)玩出了新高度:不是无脑定投,而是基于技术指标的智能加仓系统。初始仓位5%,每次DCA增加2.5%,最高不超过100%。这种渐进式资金管理比传统等额定投更科学。
关键在于DCA触发条件:价格必须跌破平均成本价,且跌幅要达到2%+步数×4%的动态阈值。第一次DCA需要跌2%,第二次需要跌6%,第三次需要跌10%。这种设计避免了在小幅波动中频繁加仓,只在真正的回调中增持。
多重技术指标组合,但逻辑清晰不冗余
策略使用3/7/18周期EMA构建趋势框架,配合20周期布林带判断价格位置,52/200/3的MACD参数设置偏向中长期信号,14周期RSI用于超买超卖判断。这个组合覆盖了趋势、动量、波动性三个维度,比单一指标策略更可靠。
买入条件严格:快EMA>慢EMA+MACD金叉+价格在布林中轨上方+RSI<65。这四个条件同时满足才开仓,过滤掉了大部分假信号。卖出条件同样严谨:必须有最低2%利润+趋势转弱+MACD死叉。这种"有利润才卖"的设计避免了无意义的止损。
100%止损设置看似激进,实则合理
代码中100%的止损看起来很夸张,但注释说得很清楚:"价格必须跌到0才触发"。这实际上是关闭了传统止损,完全依靠技术指标和利润目标来管理风险。对于DCA策略来说,这种设计是合理的——既然要在下跌中加仓,传统止损就失去了意义。
真正的风险控制在于:2%价格下跌信号+动态DCA阈值+强制盈利退出。策略会追踪500周期内的最高价,一旦当前价格较最高点下跌超过2%就触发卖出信号。这比固定止损更灵活,能够适应不同的市场环境。
资金管理是这个策略的核心竞争力
每次买入金额=当前权益×DCA百分比÷当前价格,这种按权益比例而非固定金额的设计,让策略能够随着账户增长而扩大仓位。初始5%的仓位控制了单次风险,而渐进式加仓确保了在真正的机会面前有足够的火力。
最精妙的是"just_sold"状态管理:刚卖出后不会立即重新买入,除非出现强烈的看涨信号。这避免了在震荡市场中的频繁交易,降低了手续费成本和情绪化操作的风险。
适用场景明确,不是万能策略
这个策略最适合中长期上涨趋势中的回调买入,在熊市或长期横盘中表现会很一般。MACD的52/200参数设置决定了它更适合较大级别的趋势判断,不适合短线交易。
RSI超卖阈值设在25而非30,说明策略偏向在更深度的回调中买入。这种设计在牛市中能获得更好的买点,但在熊市中可能会"接飞刀"。建议在明确的上升趋势中使用,避免在市场顶部或下降趋势中启动。
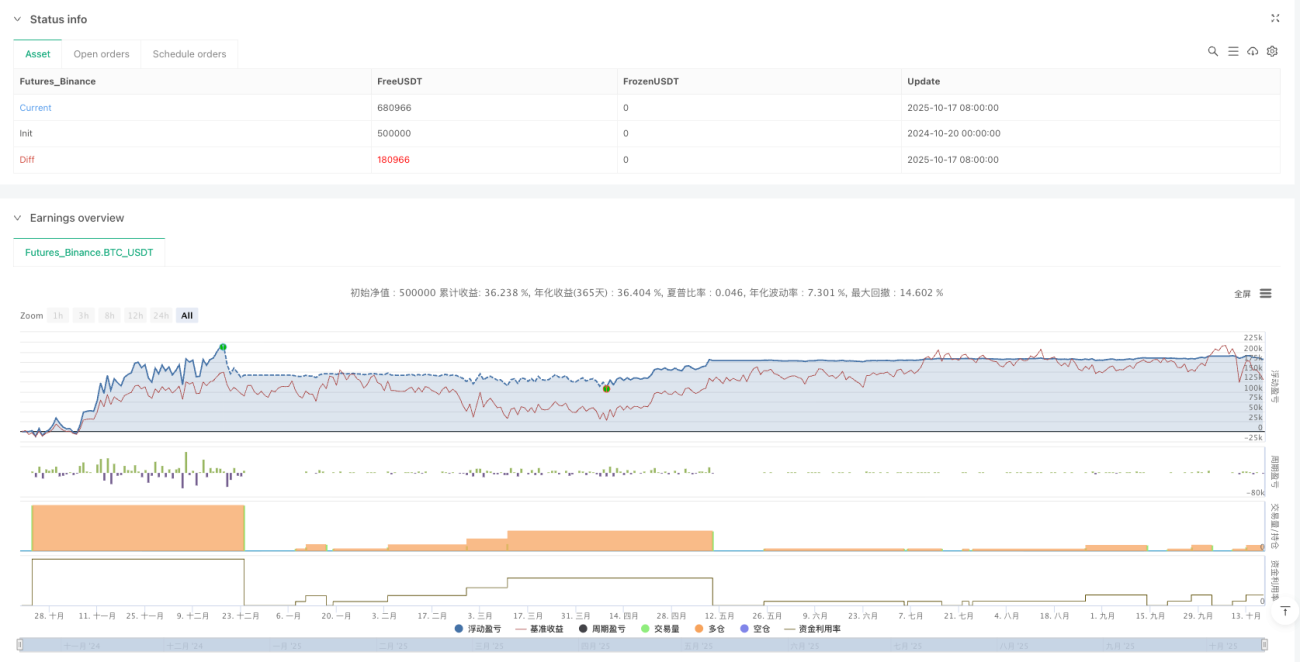
回测表现需要关注最大回撤和连续亏损
策略的理论逻辑很完善,但实际表现还要看具体的回测数据。需要重点关注:最大回撤是否在可接受范围内,连续亏损次数是否过多,不同市场环境下的表现差异。
DCA策略的天然特点是会在下跌过程中持续加仓,这意味着账户净值会先下降再上升。投资者需要有足够的心理承受能力和资金储备。建议先在小资金上测试,确认策略特性后再逐步加大投资规模。
风险提示:任何量化策略都存在亏损风险,历史回测不代表未来收益,需要严格的风险管理和适当的资金配置。
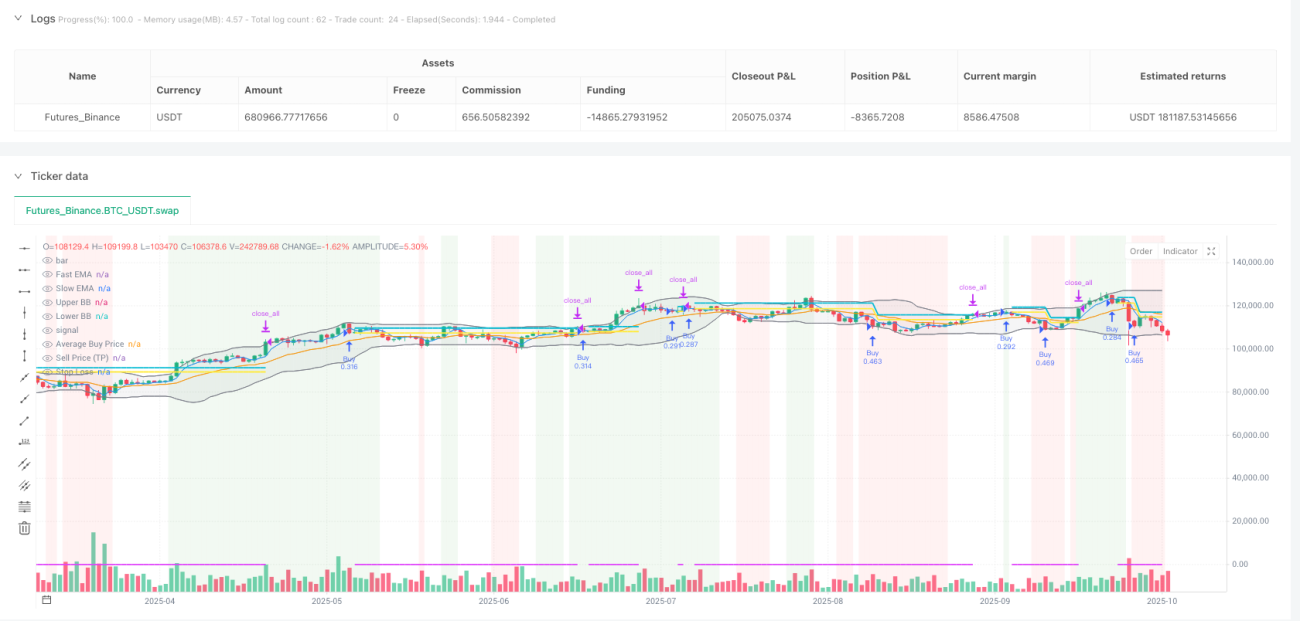
/*backtest
start: 2024-10-20 00:00:00
end: 2025-10-18 08:00:00
period: 1d
basePeriod: 1d
exchanges: [{"eid":"Futures_Binance","currency":"BTC_USDT","balance":500000}]
*/

// This Pine Script™ code is subject to the terms of the MPL 2.0 at https://mozilla.org/MPL/2.0/
// © MTB by Neurodoc
// By Nicolás Astorga
- 1