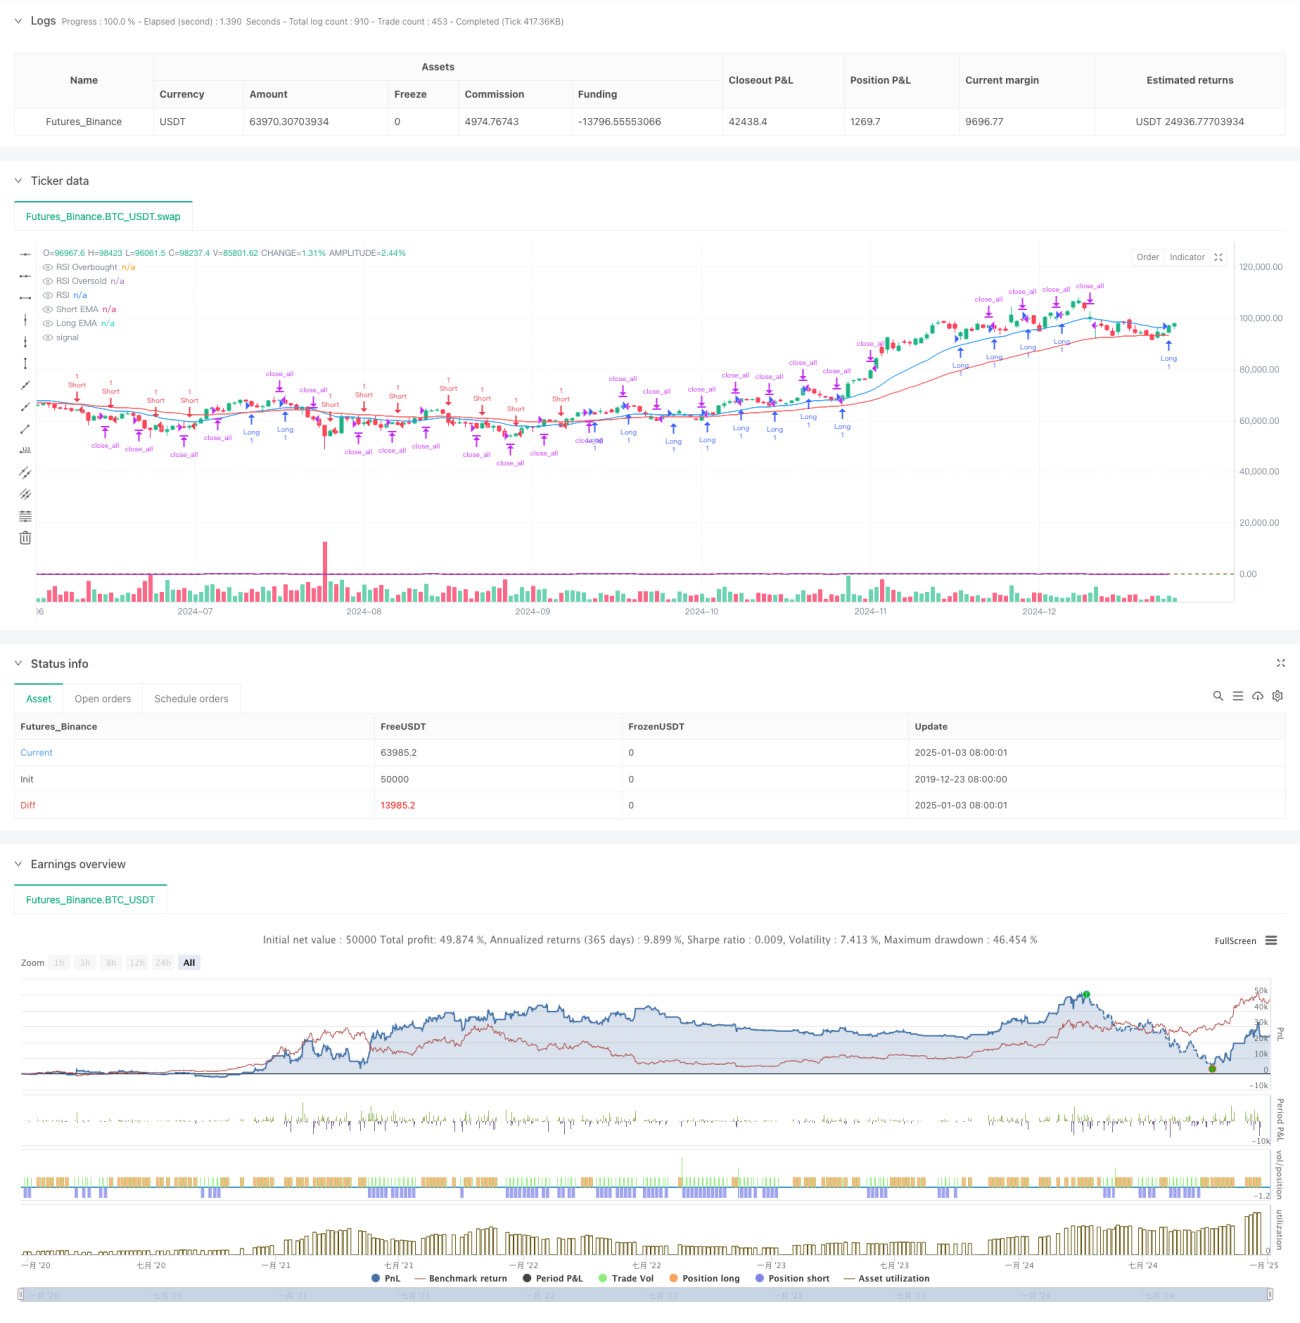
本策略是一个基于多重技术指标的趋势跟踪交易系统,结合了均线趋势、RSI超买超卖以及ATR波动率指标,通过多维度的市场分析来提高交易的胜率和收益。策略核心逻辑是通过短期和长期EMA的交叉确认趋势方向,同时利用RSI指标过滤假突破,最后结合ATR动态调整持仓时间,实现对趋势的精准把握。
策略采用20日与50日两条EMA均线作为趋势判断的主要依据。当短期EMA上穿长期EMA时,确认上升趋势;反之则确认下降趋势。在趋势确认的基础上,引入RSI指标进行超买超卖判断,当RSI低于30进入超卖区间且处于上升趋势时,触发做多信号;当RSI高于70进入超买区间且处于下降趋势时,触发做空信号。同时使用ATR指标衡量市场波动性,只有当ATR大于设定阈值时才执行交易,避免在波动率过低的市场环境中交易。
该策略通过均线趋势、RSI超买超卖和ATR波动率三个维度的综合分析,构建了一个相对完整的交易系统。策略的核心优势在于多重指标的交叉验证,能够有效降低虚假信号的影响。通过参数优化和风险控制机制的改进,策略仍有较大的优化空间。建议交易者在实盘使用时,需要根据具体市场环境调整参数,并严格执行风险控制措施。
/*backtest
start: 2019-12-23 08:00:00
end: 2025-01-04 08:00:00
period: 1d
basePeriod: 1d
exchanges: [{"eid":"Futures_Binance","currency":"BTC_USDT"}]
*/
//@version=5
strategy("High Win Rate BTC Strategy", overlay=true)
// 参数设置
emaShortLength = input(20, title="Short EMA Length")
emaLongLength = input(50, title="Long EMA Length")
rsiLength = input(14, title="RSI Length")
rsiOverbought = input(70, title="RSI Overbought Level")
rsiOversold = input(30, title="RSI Oversold Level")
atrLength = input(14, title="ATR Length")
atrThreshold = input(1.0, title="ATR Threshold")
holdBars = input(5, title="Hold Bars")
// 计算指标
emaShort = ta.ema(close, emaShortLength)
emaLong = ta.ema(close, emaLongLength)
rsi = ta.rsi(close, rsiLength)
atr = ta.atr(atrLength)
// 趋势确认
uptrend = emaShort > emaLong
downtrend = emaShort < emaLong
// 入场条件
longCondition = uptrend and close > emaShort and rsi < rsiOverbought and atr > atrThreshold
shortCondition = downtrend and close < emaShort and rsi > rsiOversold and atr > atrThreshold
// 出场条件
var int holdCount = 0
if (strategy.position_size > 0 or strategy.position_size < 0)
holdCount := holdCount + 1
else
holdCount := 0
exitCondition = holdCount >= holdBars
// 执行交易
if (longCondition)
strategy.entry("Long", strategy.long)
if (shortCondition)
strategy.entry("Short", strategy.short)
if (exitCondition)
strategy.close_all()
// 绘制指标
plot(emaShort, color=color.blue, title="Short EMA")
plot(emaLong, color=color.red, title="Long EMA")
hline(rsiOverbought, "RSI Overbought", color=color.red)
hline(rsiOversold, "RSI Oversold", color=color.green)
plot(rsi, color=color.purple, title="RSI")