
Overview
This strategy is a multi-timeframe trend following system based on Heikin-Ashi candlesticks and Exponential Moving Average (EMA) crossovers. It combines the smoothing properties of Heikin-Ashi candlesticks with the trend-following capabilities of moving averages across different timeframes, using MACD as an additional filter to accurately capture market trends. The strategy employs a hierarchical timeframe design, calculating and validating signals across 60-minute, 180-minute, and 15-minute timeframes.
Strategy Principles
The core logic includes several key components:
- Heikin-Ashi calculation: Smooths original price data through special OHLC calculations to reduce market noise.
- Multi-timeframe EMA system: Calculates Heikin-Ashi EMA on 180-minute timeframe, forming crossover signals with slow EMA on 60-minute timeframe.
- MACD filter: Calculates MACD indicator on 15-minute timeframe to validate trading signals.
- Signal generation rules: Generates buy signals when fast Heikin-Ashi EMA crosses above slow EMA with MACD confirmation (if enabled); reverse for sell signals.
Strategy Advantages
- Strong signal smoothing: Heikin-Ashi candlesticks effectively reduce false signals.
- Multi-timeframe validation: Using different timeframes increases signal reliability.
- Effective trend following: EMA crossover system effectively captures medium to long-term trends.
- Flexible filtering mechanism: Optional MACD filter provides additional signal confirmation.
- Strong parameter adaptability: Multiple key parameters can be optimized for different market characteristics.
Strategy Risks
- Choppy market risk: May generate frequent false breakout signals in sideways markets.
- Lag risk: Multi-timeframe validation may lead to slightly delayed entries.
- Parameter sensitivity: Different parameter combinations may result in significant performance variations.
- Market environment dependency: Strategy performs better in strong trend markets, may underperform in other conditions.
Optimization Directions
- Add volatility filtering: Introduce ATR or Bollinger Bands for market volatility assessment.
- Optimize timeframe selection: Adjust timeframe combinations based on specific instrument characteristics.
- Improve stop-loss mechanism: Add trailing stops or volatility-based dynamic stop-losses.
- Enhance position sizing: Dynamically adjust position sizes based on signal strength and market volatility.
- Include market environment analysis: Add trend strength indicators to differentiate market conditions.
Summary
This strategy constructs a complete trend following trading system using multi-timeframe Heikin-Ashi and EMA systems combined with MACD filtering. The design thoroughly considers signal reliability and system stability, capable of adapting to different market environments through parameter optimization and risk control mechanisms. The strategy's core strengths lie in signal smoothing and multi-validation mechanisms, while attention must be paid to choppy market risks and parameter optimization issues.
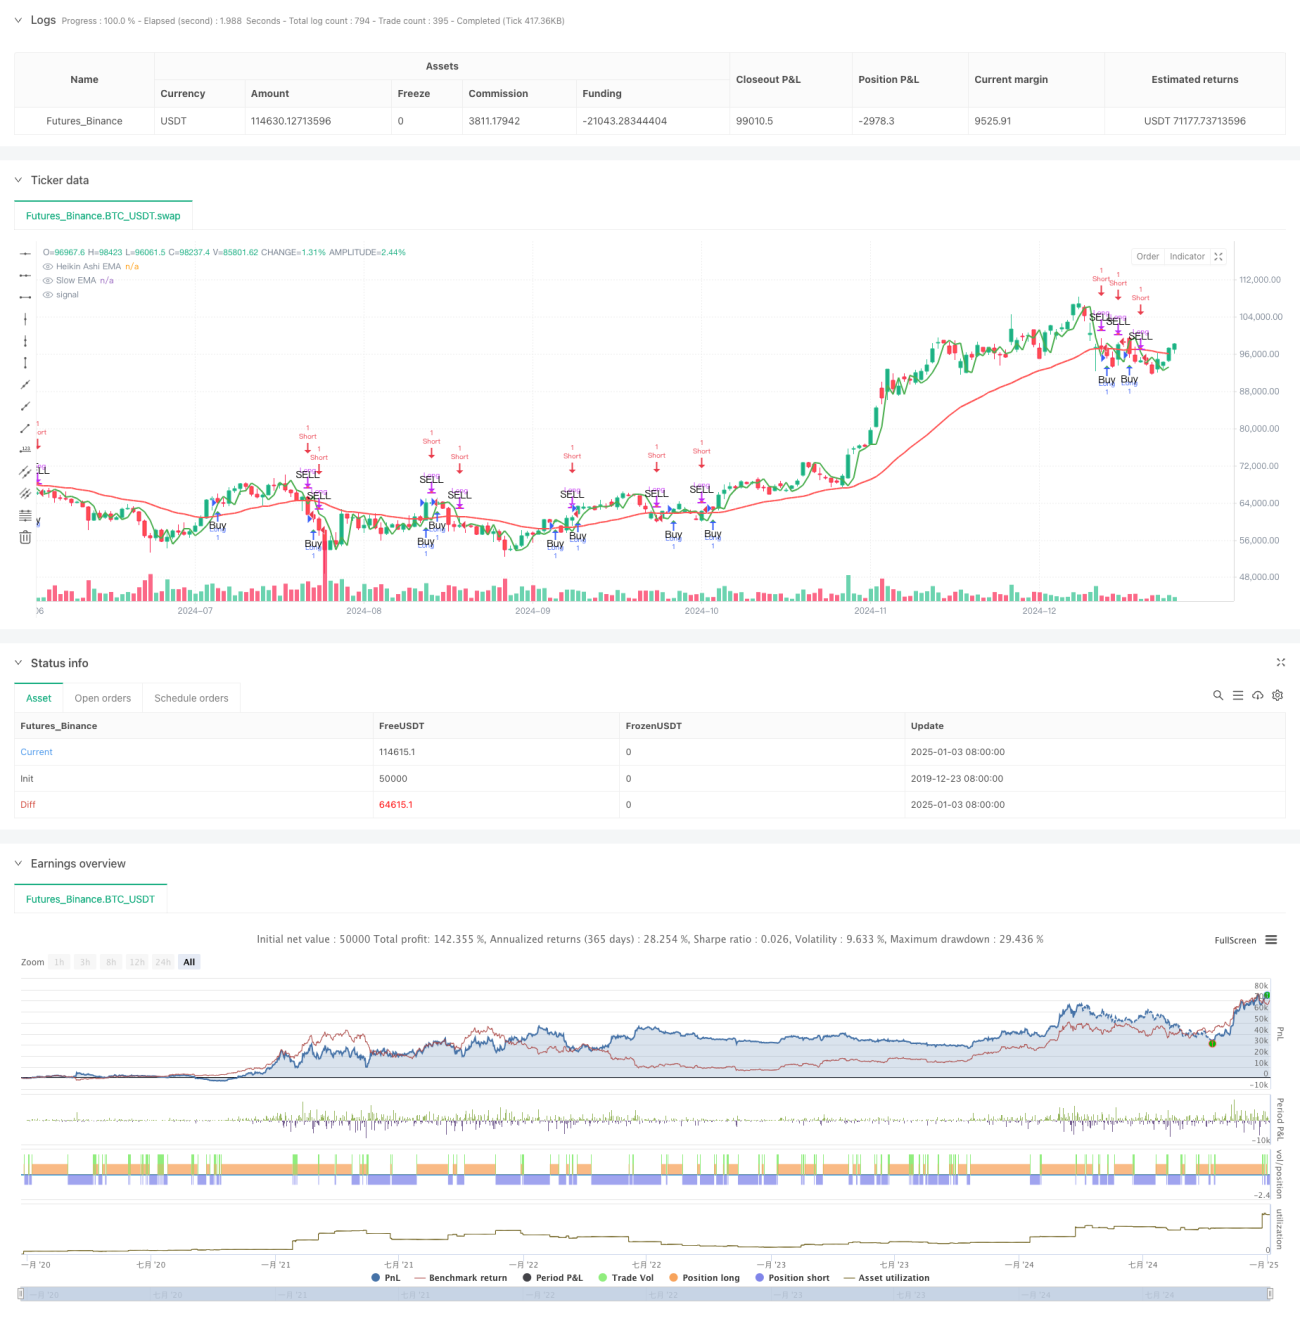
/*backtest
start: 2019-12-23 08:00:00
end: 2025-01-04 08:00:00
period: 1d
basePeriod: 1d
exchanges: [{"eid":"Futures_Binance","currency":"BTC_USDT"}]
*/

// This Pine Script™ code is subject to the terms of the Mozilla Public License 2.0 at https://mozilla.org/MPL/2.0/
// © tradingbauhaus

//@version=5- 1