
Overview
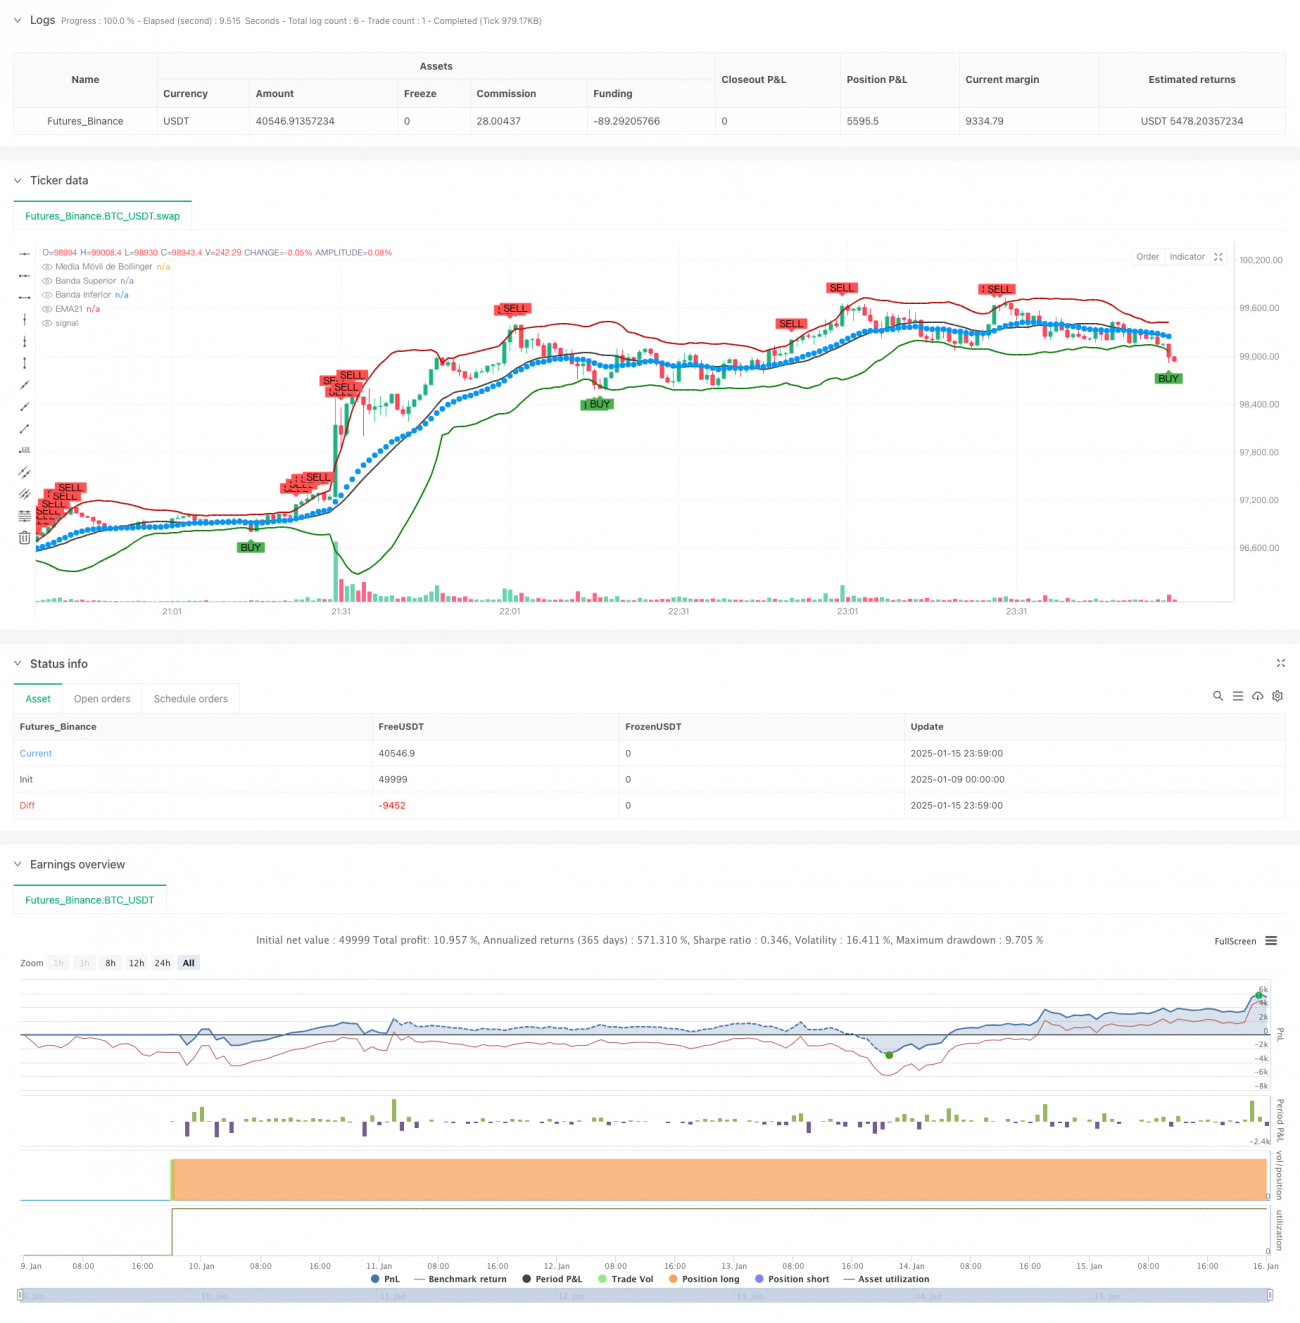
This strategy combines dynamic support/resistance levels with Bollinger Bands and EMA21 for a multi-indicator crossing trading approach. It identifies breakouts of key price levels while using technical indicator crossovers to make trading decisions. The strategy not only dynamically identifies important support/resistance levels in market structure but also confirms trading signals through the coordination of Bollinger Bands and moving averages.
Strategy Principles
The strategy is based on several core components:
- Dynamic Support/Resistance Calculation: Uses pivot point method to dynamically calculate market support/resistance levels, filtering effective price zones through channel width and minimum strength requirements.
- Bollinger Bands: Employs 20-period, 2 standard deviation Bollinger Bands to define price volatility ranges.
- EMA21: Serves as a reference line for medium-term trend judgment.
- Trade Signal Generation: Executes trades when price breaks through support/resistance levels while triggering Bollinger Band signals simultaneously.
Strategy Advantages
- Multi-dimensional Confirmation: Improves trading signal reliability by combining multiple technical indicators.
- Dynamic Adaptation: Support/resistance levels automatically adjust with market structure changes.
- Risk Management: Bollinger Bands provide clear overbought/oversold boundary definitions.
- Trend Confirmation: EMA21 helps confirm medium-term trend direction.
- Visualization: Strategy provides clear visual feedback for analysis and optimization.
Strategy Risks
- Choppy Market Risk: May generate excessive false breakout signals in sideways markets.
- Lag Risk: Technical indicators have inherent calculation delays, potentially missing optimal entry points.
- Parameter Sensitivity: Strategy performance is sensitive to parameter settings, requiring optimization for different market environments.
- False Breakout Risk: Support/resistance breakouts may be false, requiring confirmation from other indicators.
Optimization Directions
- Incorporate Volume Indicators: Add volume analysis for breakout confirmation to improve signal reliability.
- Optimize Parameter Adaptation: Develop adaptive parameter adjustment mechanisms for better market environment adaptation.
- Enhance Stop-Loss Mechanisms: Design more comprehensive stop-loss strategies to control drawdown risk.
- Add Trend Filters: Increase trend strength assessment to avoid trading in weak trend environments.
- Timeframe Optimization: Study different timeframe combinations to find optimal configurations.
Summary
This strategy builds a relatively complete trading system by combining dynamic support/resistance, Bollinger Bands, and EMA21. Its strengths lie in multi-dimensional signal confirmation and dynamic market adaptation, while facing challenges in parameter optimization and false breakout risks. Through continuous optimization and improvement of risk control mechanisms, the strategy shows promise for better performance in actual trading.
//@version=5
strategy("Support Resistance & Bollinger & EMA21", overlay=true)

// Parámetros de S/R
prd = input.int(defval=10, title='Pivot Period', minval=4, maxval=30, group='Setup')
ppsrc = input.string(defval='High/Low', title='Source', options=['High/Low', 'Close/Open'], group='Setup')
maxnumpp = input.int(defval=20, title='Maximum Number of Pivot', minval=5, maxval=100, group='Setup')
ChannelW = input.int(defval=10, title='Maximum Channel Width %', minval=1, group='Setup')
maxnumsr = input.int(defval=5, title='Maximum Number of S/R', minval=1, maxval=10, group='Setup')
min_strength = input.int(defval=2, title='Minimum Strength', minval=1, maxval=10, group='Setup')
labelloc = input.int(defval=20, title='Label Location', group='Colors', tooltip='Positive numbers reference future bars, negative numbers reference historical bars')
linestyle = input.string(defval='Solid', title='Line Style', options=['Solid', 'Dotted', 'Dashed'], group='Colors')- 1