Pivot Based Trailing Maxima & Minima

This indicator returns trailing maximums/minimums and their average resetting at the occurrence of a pivot point high/low, thus allowing the highlighting of past and current support and resistance levels.
Settings
Length: Determines the pivot high/low lookback, with higher values allowing to detect longer term tops and bottoms.
Usage
snapshot
The indicator can highlight points of support and resistances - these are points where price bounced of the average line. These points can eventually be used to draw trendlines .
snapshot
The trailing maximum/minimum and their average extends to the most recent bar, allowing real time applications of the indicator.
Additionally, users can easily analyze past trends and determine their type by observing the trailing maximum/minimum behavior. For example, trailing maximums/minimums not making new higher high/lower low would indicate a ranging market.
snapshot
The frequency of new higher high/lower low can also help determine how bullish / bearish a trend was.
backtest
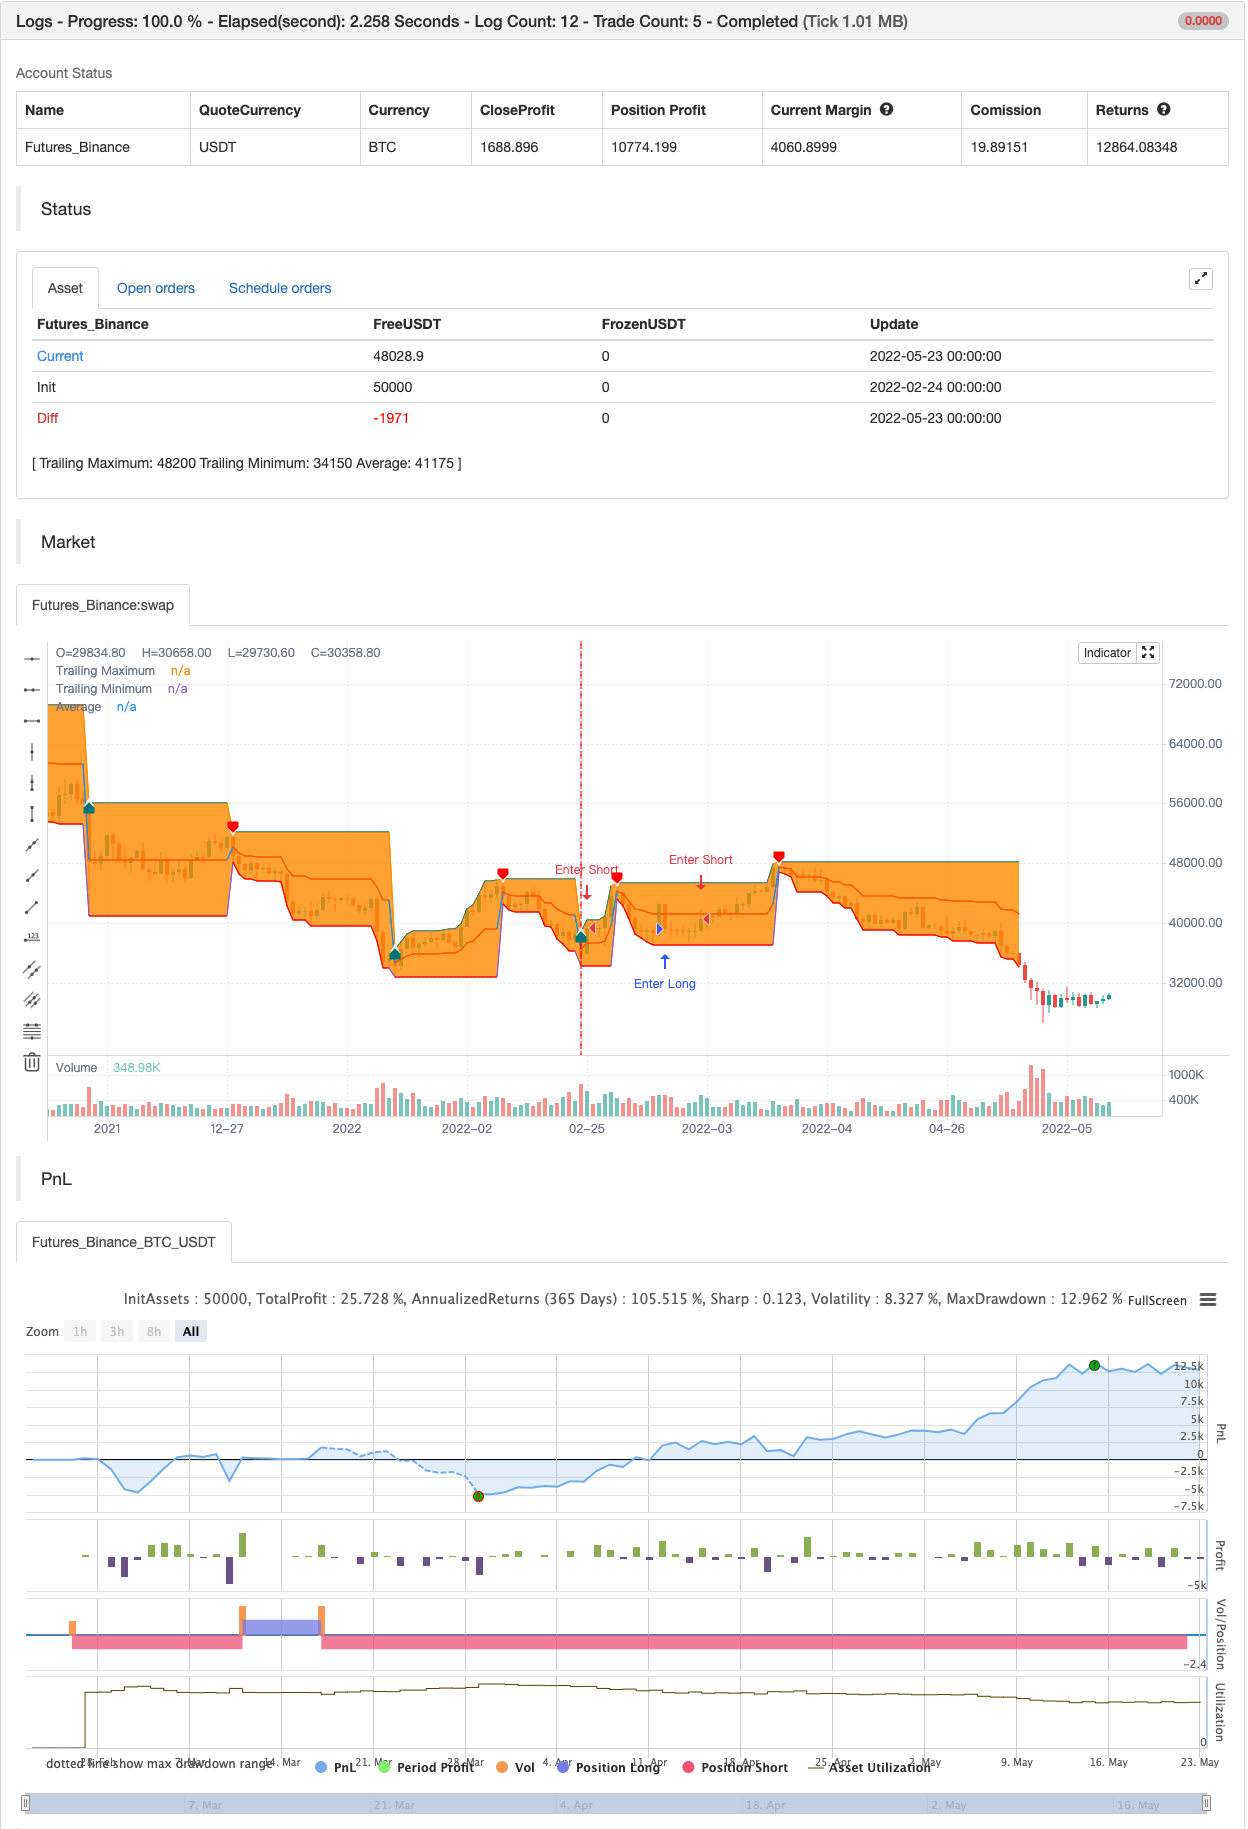
/*backtest
start: 2022-02-24 00:00:00
end: 2022-05-23 23:59:00
period: 1d
basePeriod: 1h
exchanges: [{"eid":"Futures_Binance","currency":"BTC_USDT"}]
*/

// This work is licensed under a Attribution-NonCommercial-ShareAlike 4.0 International (CC BY-NC-SA 4.0) https://creativecommons.org/licenses/by-nc-sa/4.0/
// © LuxAlgo

//@version=5- 1