
概述
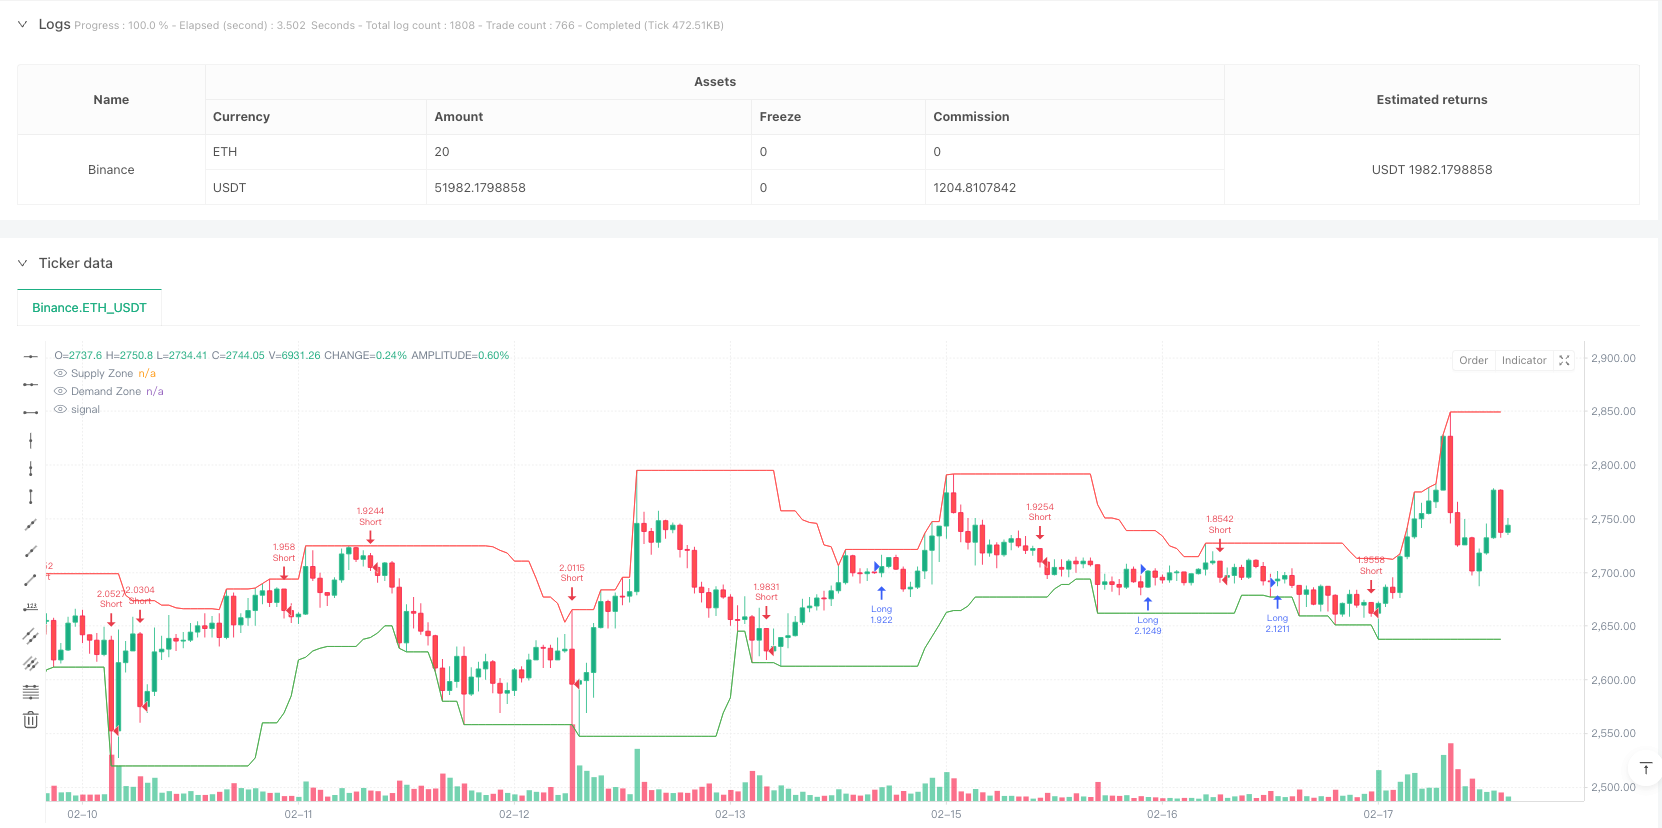
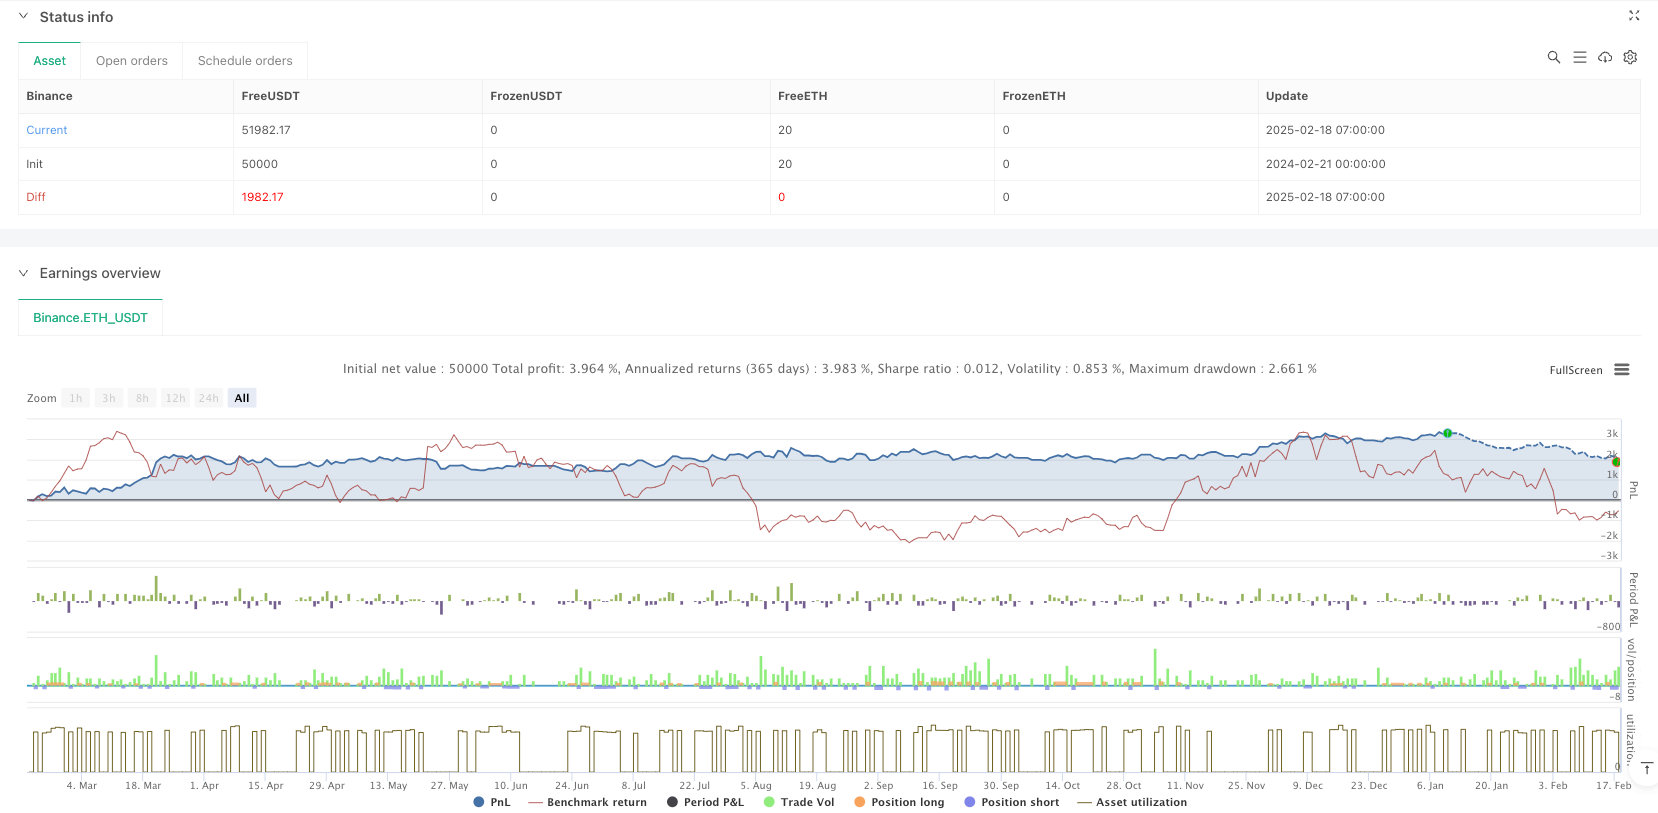
该策略是一个融合了ICT(内部交易商概念)、吞没形态和供需区域分析的综合交易系统。它通过多维度分析市场结构,结合技术指标和价格行为来识别高概率交易机会。策略在15分钟时间框架上运行,采用百分比止损止盈方式来管理风险。
策略原理
策略的核心逻辑基于三个主要组成部分: 1. 使用20个周期的最高价和最低价来建立供需区域,这些区域作为重要的支撑和阻力位。 2. 通过分析相邻蜡烛图之间的关系来识别看涨和看跌吞没形态。 3. 当价格突破供需区域且出现吞没形态时,系统会在考虑风险管理的情况下执行交易。
系统使用资金的10%进行每次交易,并设置了1.5%的止损和3%的止盈,这种设置提供了2:1的风险收益比。
策略优势
- 多维度分析提高了交易信号的可靠性
- 结合了价格行为和技术分析,降低了假信号的影响
- 使用百分比止损止盈,适应不同市场条件
- 资金管理系统合理,每次使用10%的资金降低了风险
- 可以通过参数调整适应不同市场环境
策略风险
- 在高波动市场中可能会触发频繁的止损
- 供需区域的识别可能在某些市场条件下不够准确
- 15分钟时间框架可能会产生过多交易信号
- 固定的止损止盈百分比可能不适合所有市场条件
风险控制建议: - 建议在不同市场条件下调整参数 - 考虑增加确认指标 - 可以根据波动率动态调整止损止盈水平
策略优化方向
- 引入波动率指标动态调整止损止盈水平
- 增加交易量分析来确认信号强度
- 考虑添加趋势过滤器减少逆势交易
- 优化供需区域的识别算法,可以考虑使用多重时间框架分析
- 添加市场状态识别功能,在不同市场条件下使用不同的参数设置
总结
这是一个结构完善的综合交易系统,通过多维度分析提供了可靠的交易信号。系统的风险管理合理,但仍有优化空间。建议交易者在实盘使用前进行充分的回测,并根据具体市场条件调整参数。策略的模块化设计使其具有良好的可扩展性,可以根据需要添加新的分析维度。
策略源码
/*backtest
start: 2024-02-21 00:00:00
end: 2025-02-18 08:00:00
period: 1h
basePeriod: 1h
exchanges: [{"eid":"Binance","currency":"ETH_USDT"}]
*/

//@version=5
strategy("ICT + Engulfing + Supply & Demand", overlay=true, default_qty_type=strategy.percent_of_equity, default_qty_value=10)

// Input settings
timeframe = input.timeframe("15", title="Backtest Timeframe")
use_snd = input(true, title="Enable Supply & Demand Zones")
stopLossPerc = input(1.5, title="Stop Loss %")
takeProfitPerc = input(3, title="Take Profit %")

// Identify Engulfing Patterns
bullishEngulfing = (close[1] < open[1]) and (close > open) and (close > open[1]) and (open < close[1])
bearishEngulfing = (close[1] > open[1]) and (close < open) and (close < open[1]) and (open > close[1])

// Supply & Demand Zones (basic identification)
highestHigh = ta.highest(high, 20)
lowestLow = ta.lowest(low, 20)
supplyZone = use_snd ? highestHigh : na
demandZone = use_snd ? lowestLow : na

// Entry & Exit Conditions
longCondition = bullishEngulfing and close > demandZone
shortCondition = bearishEngulfing and close < supplyZone

// Stop-Loss & Take-Profit Calculation
longSL = close * (1 - stopLossPerc / 100)
longTP = close * (1 + takeProfitPerc / 100)
shortSL = close * (1 + stopLossPerc / 100)
shortTP = close * (1 - takeProfitPerc / 100)

// Execute trades
if (longCondition)
    strategy.entry("Long", strategy.long)
    strategy.exit("Long Exit", from_entry="Long", stop=longSL, limit=longTP)

if (shortCondition)
    strategy.entry("Short", strategy.short)
    strategy.exit("Short Exit", from_entry="Short", stop=shortSL, limit=shortTP)

// Plot Supply & Demand Zones
plot(use_snd ? supplyZone : na, color=color.red, title="Supply Zone")
plot(use_snd ? demandZone : na, color=color.green, title="Demand Zone")
相关推荐