
2
关注
502
关注者
概述
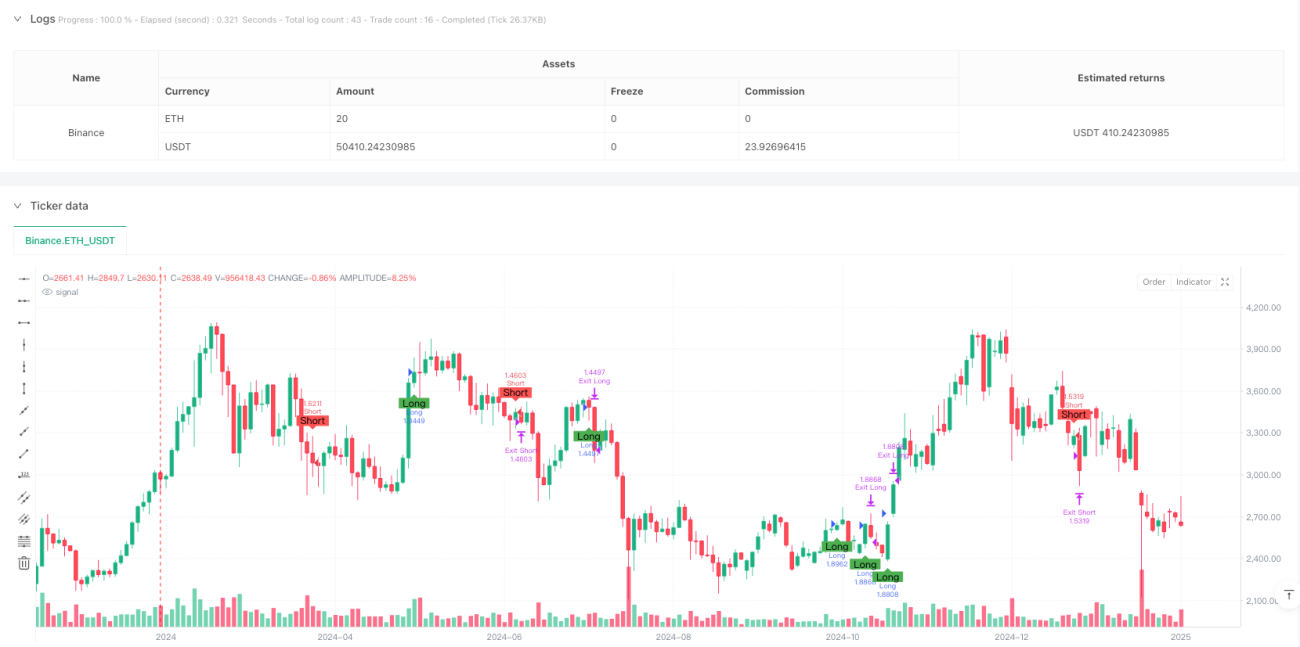
这是一个基于多重技术指标交叉信号的智能型趋势跟踪策略。该策略整合了移动平均线(EMA)、相对强弱指标(RSI)和移动平均线趋同散度(MACD)三大技术指标,通过多维度信号确认来识别市场趋势,并配合动态止损止盈进行风险管理。策略设计采用全自动化交易方式,特别适合日内交易。
策略原理
策略的核心逻辑基于三层技术指标过滤:
- 使用9周期和21周期的指数移动平均线(EMA)交叉来确认趋势方向
- 利用相对强弱指标(RSI)过滤超买超卖区域,避免在极端市场条件下入场
- 通过MACD指标进一步确认趋势强度和方向
入场信号的产生需同时满足以下条件:
- 做多条件:短期EMA上穿长期EMA,RSI低于70,且MACD线在信号线上方
- 做空条件:短期EMA下穿长期EMA,RSI高于30,且MACD线在信号线下方
策略采用资金百分比持仓模式,每次交易使用10%的账户权益,并配合2%的止盈和1%的止损进行风险控制。
策略优势
- 多重指标交叉验证,大幅降低虚假信号风险
- 动态止损止盈设置,根据入场价格自动调整风险管理水平
- 百分比仓位管理,实现资金利用的最优化配置
- 全自动化执行,无需人工干预,降低情绪影响
- 完整的风险管理体系,包括位置控制和止损止盈机制
策略风险
- 多重指标可能导致信号滞后,在快速行情中错过机会
- 固定百分比的止损止盈可能在波动性较大的市场中过早触发
- 依赖技术指标可能在横盘市场产生过多虚假信号
- 佣金成本对策略收益有显著影响
风险控制建议:
- 根据市场波动情况动态调整止损止盈比例
- 增加趋势强度过滤器,减少横盘市场的交易频率
- 优化持仓时间管理,避免隔夜风险
策略优化方向
- 指标参数优化
- 对EMA周期进行优化,寻找最佳的短期和长期周期组合
- 调整RSI的超买超卖阈值,适应不同市场环境
- 优化MACD参数,提高趋势识别的准确性
- 风险管理优化
- 实现动态止损止盈比例,根据市场波动性自动调整
- 增加最大回撤控制机制
- 引入时间退出机制,避免长期套牢
- 交易执行优化
- 增加交易量过滤器,避免在低流动性环境下交易
- 实现分批建仓和平仓机制,优化成本均价
- 加入市场波动性指标,动态调整持仓比例
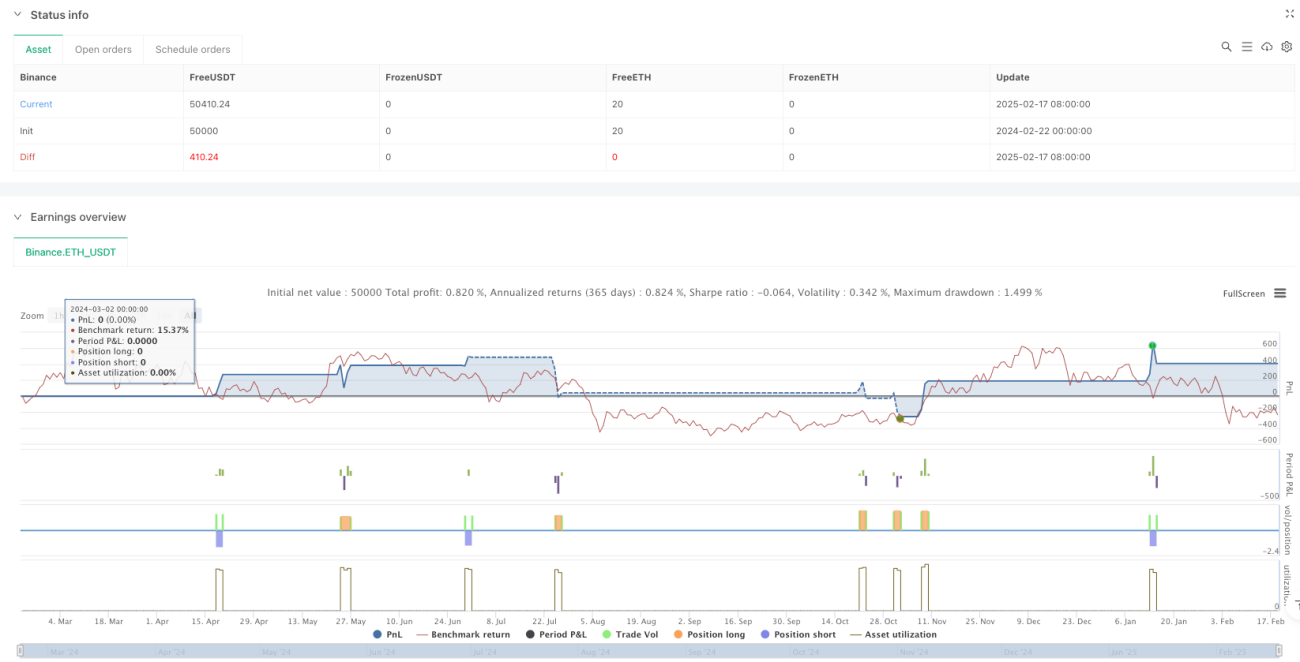
总结
该策略通过多重技术指标的协同作用,构建了一个相对完善的趋势跟踪系统。策略的优势在于信号可靠性高、风险管理完善,但也存在一定的滞后性和对市场环境的依赖性。通过建议的优化方向,策略可以进一步提升其适应性和稳定性。在实盘应用中,建议进行充分的回测和参数优化,并结合市场实际情况进行适当调整。
策略源码
Pine
策略参数
相关策略
评论
全部评论 (0)
暂无数据
- 1