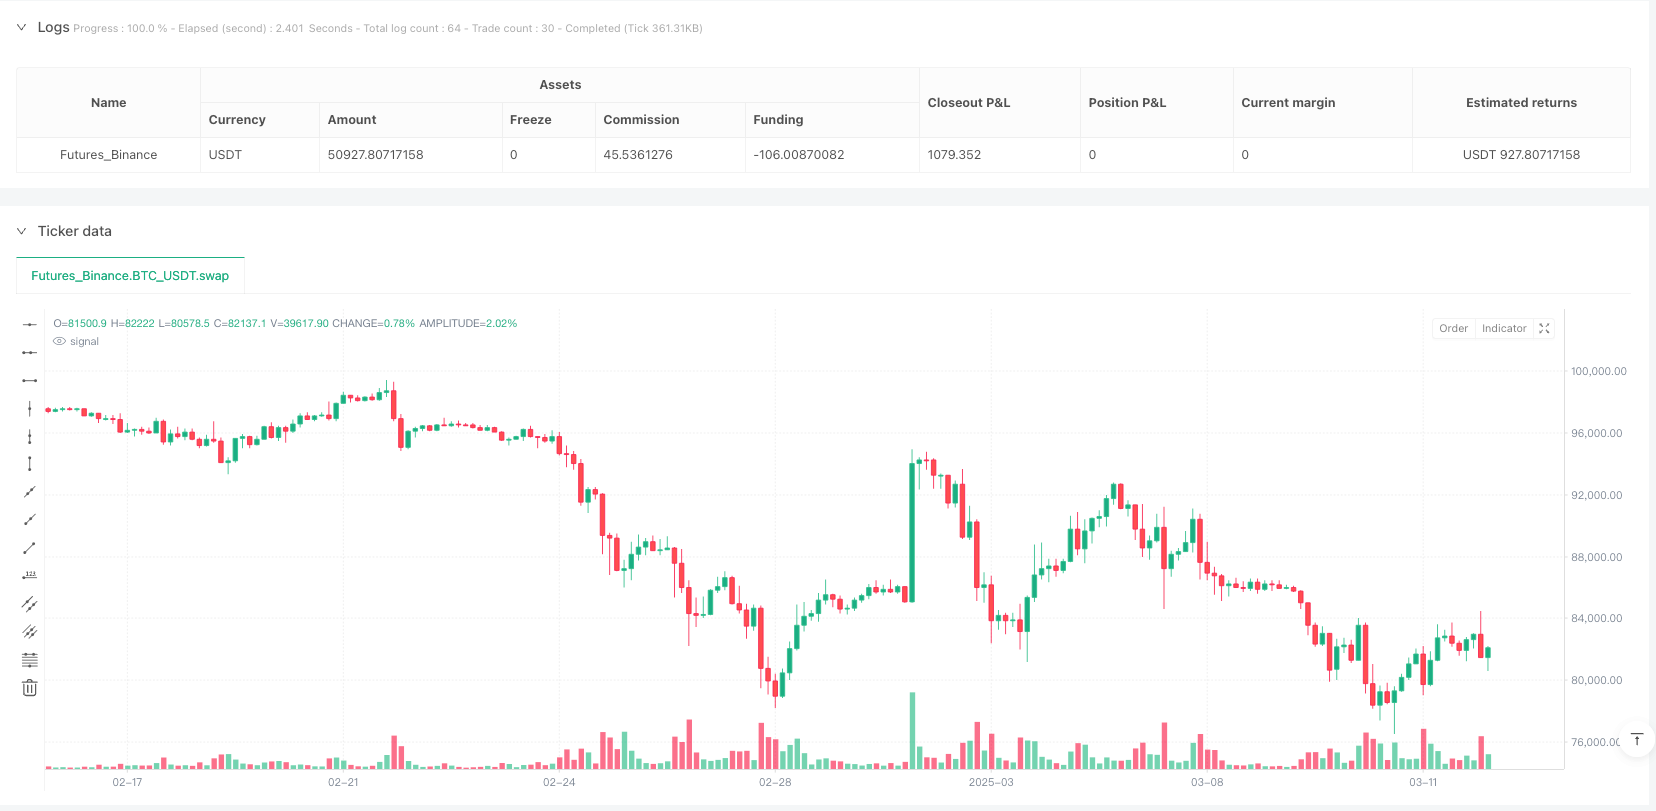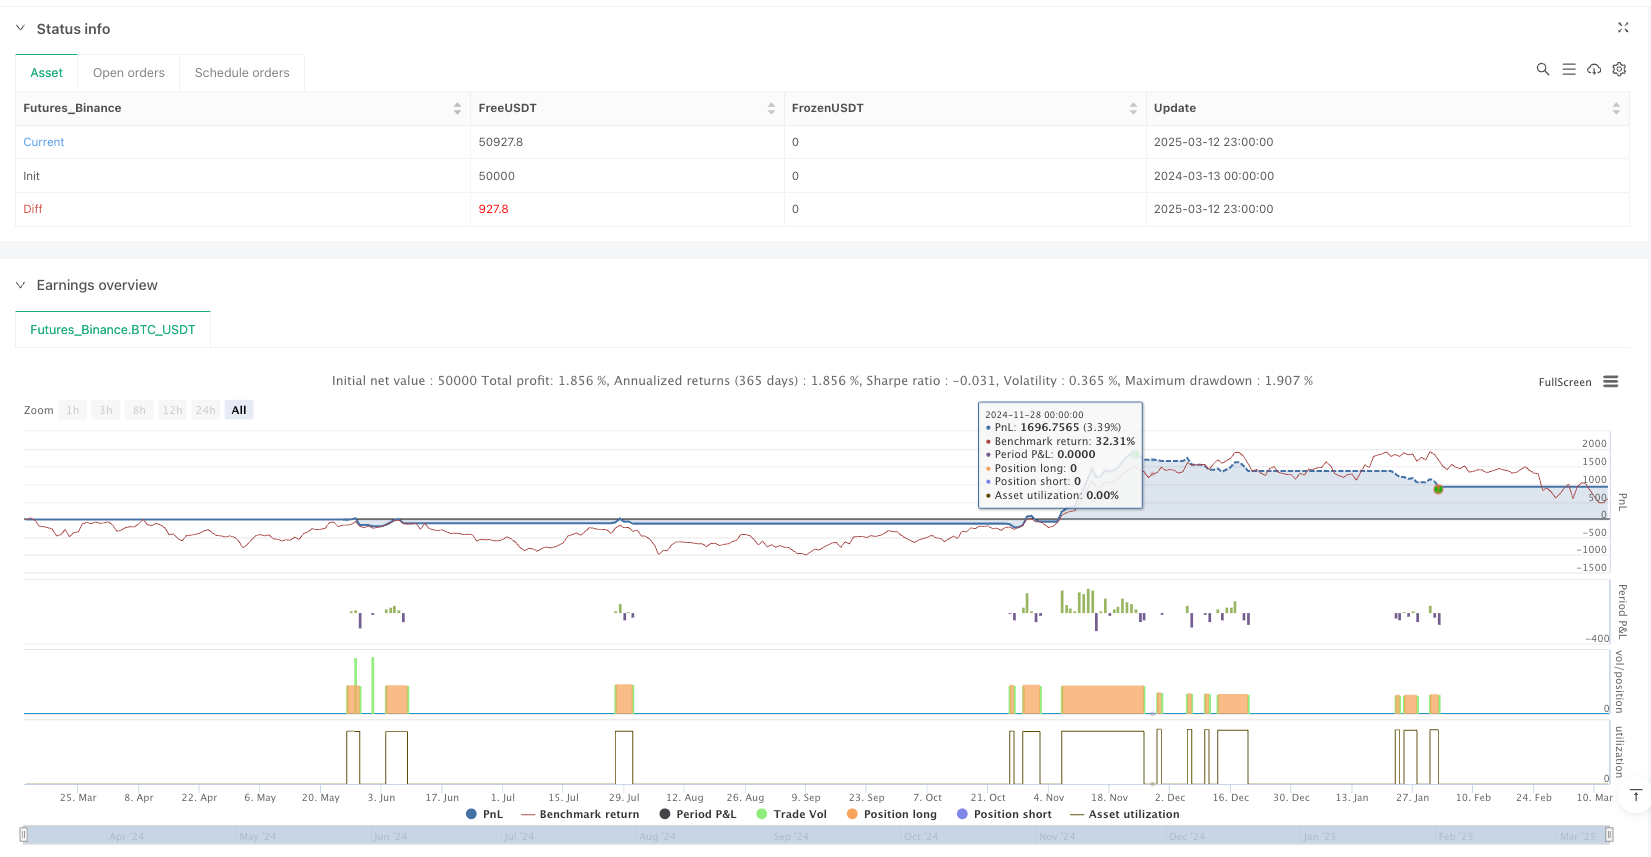

策略概述
此量化交易策略巧妙结合了相对强弱指数(RSI)与指数移动平均线(EMA)的优势,并引入多时间框架分析作为过滤机制。该策略核心设计围绕日线和周线RSI指标的协同确认,通过EMA交叉捕捉趋势转变点,旨在识别具有持续性的动量交易机会。策略采用自适应的进出场逻辑,利用多重技术指标的交叉验证,有效提高了交易信号的可靠性。
策略原理
策略基于以下核心原理设计:
多时间框架RSI过滤:
- 日线RSI作为主要信号生成来源
- 周线RSI作为趋势确认过滤器,确保交易方向与更大周期趋势一致
- 买入条件要求周线RSI>55,日线RSI>55
- 卖出条件要求周线RSI<45,日线RSI<45
EMA交叉系统:
- 使用13周期和21周期的EMA交叉作为主要入场信号
- 34周期和55周期的EMA提供支撑/阻力位和出场参考
- 快速EMA(13周期)上穿慢速EMA(21周期)触发买入信号
- 快速EMA下穿慢速EMA触发卖出信号
信号确认机制:
- 只有当EMA交叉信号与两个时间框架的RSI方向一致时才执行交易
- 通过request.security函数实现不同时间框架的数据整合
- 多重条件筛选减少假信号和震荡行情下的频繁交易
精确的出场策略:
- 多头出场条件为EMA1下穿EMA3或价格跌破EMA4
- 空头出场条件为EMA1上穿EMA3或价格突破EMA4
- 平仓逻辑与开仓条件独立,更注重风险控制
策略优势
通过深入分析代码,可以总结出该策略具有以下显著优势:
多层次信号过滤系统:
- 整合短期和长期RSI,降低假突破风险
- 结合多条EMA形成动态支撑阻力区域,提高信号质量
- 多重确认机制显著减少”震荡市场”下的无效交易
适应性强的趋势识别:
- 能够在趋势初始阶段提前介入,而非趋势成熟后才进场
- 通过周线RSI的高级过滤,避免与主要趋势方向相反的交易
- EMA交叉系统对市场噪音具有天然过滤作用
完善的风险管理机制:
- 清晰的出场条件设计,避免情绪化持仓
- 在逆转信号出现时自动平仓,有效控制回撤
- 通过平仓后再开反向仓位的设计,增强资金效率
高度可定制性:
- 所有关键参数均通过input函数实现可调节
- 支持个性化调整RSI阈值和EMA长度,适应不同市场环境
- 可根据不同品种特性自定义信号敏感度
策略风险
尽管该策略设计合理,仍存在以下潜在风险和局限性:
参数敏感性:
- RSI和EMA参数的选择对策略表现影响显著
- 过于敏感的参数可能导致过度交易
- 解决方法:基于历史数据进行参数优化和回测,避免过度拟合
区间震荡市场表现不佳:
- 在没有明显趋势的横盘市场中可能产生频繁的假信号
- EMA交叉策略在震荡市场天然弱势
- 解决方法:增加波动率过滤器或趋势强度指标,在低趋势强度环境下自动降低持仓比例
滞后性问题:
- EMA和RSI均为滞后指标,可能在剧烈波动市场中反应不及时
- 信号确认过程中可能错过最佳入场点
- 解决方法:考虑引入前瞻性指标如成交量或价格形态识别
信号稀少:
- 多重条件筛选可能导致交易信号较少
- 在低波动率环境下可能长期无交易机会
- 解决方法:考虑增加辅助交易信号或适当放宽条件要求
策略优化方向
基于代码分析,以下是该策略可能的优化方向:
自适应参数系统:
- 实现RSI阈值和EMA周期的动态调整,基于市场波动率自动优化
- 加入ATR(平均真实波幅)指标,根据市场波动调整止损位置
- 引入市场状态分类,在趋势和震荡市场使用不同的参数设置
增强信号质量:
- 整合成交量确认机制,要求信号出现时伴随成交量增加
- 加入针对假突破的价格行为筛选,如要求收盘价站稳EMA
- 引入趋势强度指标如ADX,仅在强趋势环境下执行完整仓位交易
改进资金管理:
- 实现基于波动率的动态仓位管理,高波动环境下自动减仓
- 引入金字塔式加仓策略,在趋势确认后分批增加持仓
- 设计基于风险回报比的智能止损止盈系统
多市场适应性:
- 增加商品特性分析,针对不同类别品种自动调整策略参数
- 实现市场相关性分析,避免过度集中风险
- 增加日内和长周期信号协同机制,形成多级别交易系统
总结
多时间框架RSI与EMA交叉量化动量策略是一个设计精巧的量化交易系统,通过整合不同时间周期的RSI指标与多重EMA构建了一个立体的信号生成和过滤机制。该策略核心优势在于其多层次的确认系统,既可有效捕捉趋势转折点,又能避免在震荡市场中频繁交易。
策略的风险主要集中在参数敏感性和震荡市场表现上,但通过引入自适应参数系统和增强的市场状态识别机制,这些风险可以得到有效缓解。未来优化方向应围绕信号质量提升、动态参数调整和智能资金管理展开,以提高策略在不同市场环境下的鲁棒性和稳定性。
从整体来看,该策略逻辑清晰、设计合理,是一个具有实战价值的量化交易系统。通过精细调整和持续优化,可以发展成为一个适应性强、风险可控的长期交易方案。
策略源码
/*backtest
start: 2024-03-13 00:00:00
end: 2025-03-13 00:00:00
period: 3h
basePeriod: 3h
exchanges: [{"eid":"Futures_Binance","currency":"BTC_USDT"}]
*/

//@version=6
strategy("RSI & EMA Crossover Strategy with Daily & Weekly RSI Filter", overlay=true, default_qty_type=strategy.percent_of_equity, default_qty_value=10)

// === INPUTS ===
rsiLength = input(14, "RSI Length")
rsiOverbought = input(70, "RSI Overbought")
rsiOversold = input(30, "RSI Oversold")
dailyRSIThresholdBuy = input(55, "Daily RSI Buy Threshold")
dailyRSIThresholdSell = input(45, "Daily RSI Sell Threshold")
weeklyRSIThresholdBuy = input(55, "Weekly RSI Buy Threshold")
weeklyRSIThresholdSell = input(45, "Weekly RSI Sell Threshold")

ema1Length = input(13, "EMA 1 Length")
ema2Length = input(21, "EMA 2 Length")
ema3Length = input(34, "EMA 3 Length")
ema4Length = input(55, "EMA 4 Length")

// === RSI CALCULATION ===
currentRSI = ta.rsi(close, rsiLength)
dailyRSI = request.security(syminfo.tickerid, "D", ta.rsi(close, rsiLength), lookahead=barmerge.lookahead_on)
weeklyRSI = request.security(syminfo.tickerid, "W", ta.rsi(close, rsiLength), lookahead=barmerge.lookahead_on)

// === EMA CALCULATIONS ===
ema1 = ta.ema(close, ema1Length)
ema2 = ta.ema(close, ema2Length)
ema3 = ta.ema(close, ema3Length)
ema4 = ta.ema(close, ema4Length)

// === BUY CONDITION ===
buySignal = ta.crossover(ema1, ema2) and dailyRSI > dailyRSIThresholdBuy and weeklyRSI > weeklyRSIThresholdBuy

// === SELL CONDITION ===
sellSignal = ta.crossunder(ema1, ema2) and dailyRSI < dailyRSIThresholdSell and weeklyRSI < weeklyRSIThresholdSell

// === EXIT CONDITIONS ===
exitLong = ta.crossunder(ema1, ema3) or close < ema4
exitShort = ta.crossover(ema1, ema3) or close > ema4

// === STRATEGY EXECUTION ===
if (buySignal)
    strategy.close("Short")  // Close short position before opening long
    strategy.entry("Long", strategy.long)
if (sellSignal)
    strategy.close("Long")  // Close long position before opening short
    strategy.entry("Short", strategy.short)

if (exitLong)
    strategy.close("Long")
if (exitShort)
    strategy.close("Short")

// === PLOTTING SIGNALS ===
plotshape(series=buySignal, location=location.belowbar, color=color.green, style=shape.labelup, title="Buy Signal")
plotshape(series=sellSignal, location=location.abovebar, color=color.red, style=shape.labeldown, title="Sell Signal")

// === ALERTS ===
alertcondition(buySignal, title="Buy Alert", message="Buy Signal Triggered")
alertcondition(sellSignal, title="Sell Alert", message="Sell Signal Triggered")
alertcondition(exitLong, title="Exit Long Alert", message="Exit Long Position")
alertcondition(exitShort, title="Exit Short Alert", message="Exit Short Position")
相关推荐