
Overview
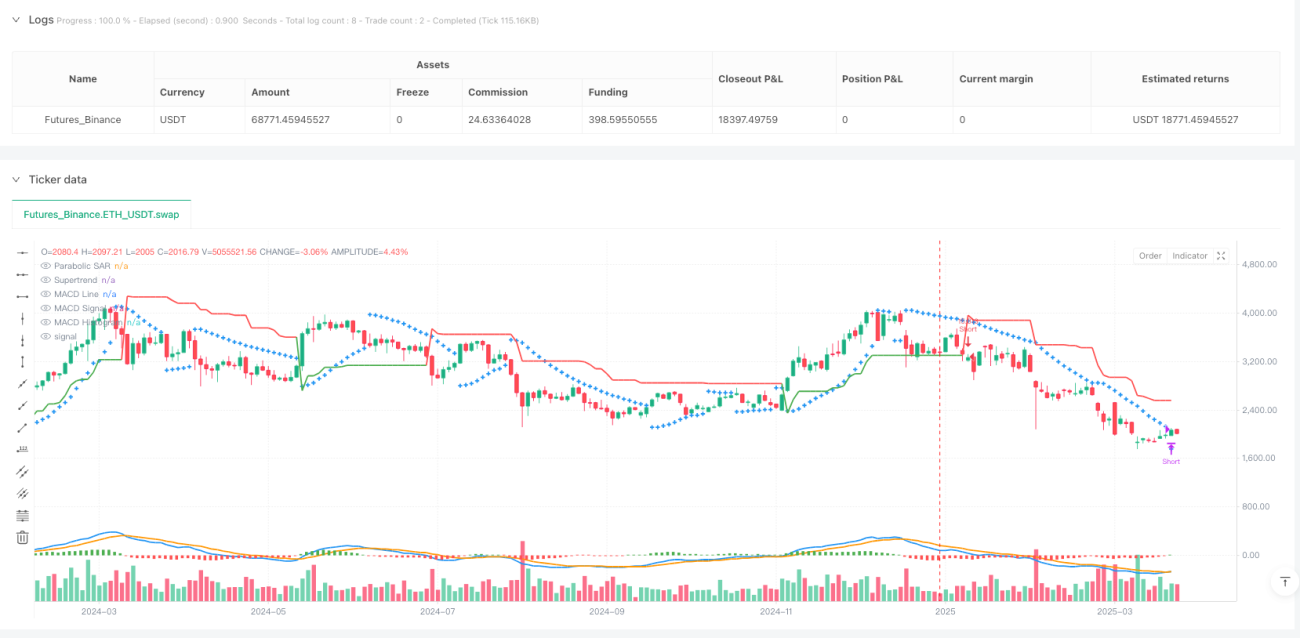
This strategy is a comprehensive quantitative trading method that integrates multiple technical indicators (MACD, Supertrend, and Parabolic SAR) to identify market trends and trading signals. The strategy aims to provide a flexible and rigorous decision-making framework adaptable to different market environments.
Strategy Principles
The strategy is based on the dynamic combination of three key technical indicators:
- MACD Indicator: Evaluates price momentum and trend direction
- Supertrend Indicator: Determines the dominant market trend (bullish or bearish)
- Parabolic SAR: Provides precise entry and exit signals
The strategy makes trading decisions through the following logic:
- Long Entry Conditions:
- MACD line above signal line
- Supertrend is green (bullish)
- Closing price above Parabolic SAR
- Short Entry Conditions:
- MACD line below signal line
- Supertrend is red (bearish)
- Closing price below Parabolic SAR
Strategy Advantages
- Multi-indicator Verification: Reduces false signal risk
- Flexible Signal Triggering: No strict order requirement for indicators
- Full Position Trading Strategy: Maximizes potential earnings per trade
- Symmetric Trading Logic: Consistent performance in bullish and bearish markets
- Dynamic Exit Mechanism: Confirms exit through two consecutive candles
Strategy Risks
- Indicator Lag Risk: Technical indicators based on historical data may have delays
- Full Position Trading Risk: Lack of stop-loss can lead to significant capital fluctuations
- Severe Market Volatility Risk: Complex market environments may affect strategy performance
- Parameter Sensitivity: Indicator parameter selection directly impacts strategy effectiveness
Strategy Optimization Directions
- Introduce Dynamic Position Management: Adjust position size based on market volatility
- Add Stop-Loss Mechanism: Reduce maximum loss per trade
- Optimize Indicator Parameters: Find the best parameter combination through backtesting
- Introduce Additional Filter Conditions: Such as trading volume, volatility indicators
- Increase Multi-Timeframe Verification: Improve signal reliability
Summary
The Vishal Adaptive Multi-Indicator Trading Strategy is an innovative quantitative trading approach that provides a comprehensive and flexible trading decision framework through the synergistic action of MACD, Supertrend, and Parabolic SAR. Despite certain risks, its multi-indicator verification and symmetric trading logic offer investors a trading model worth in-depth research.
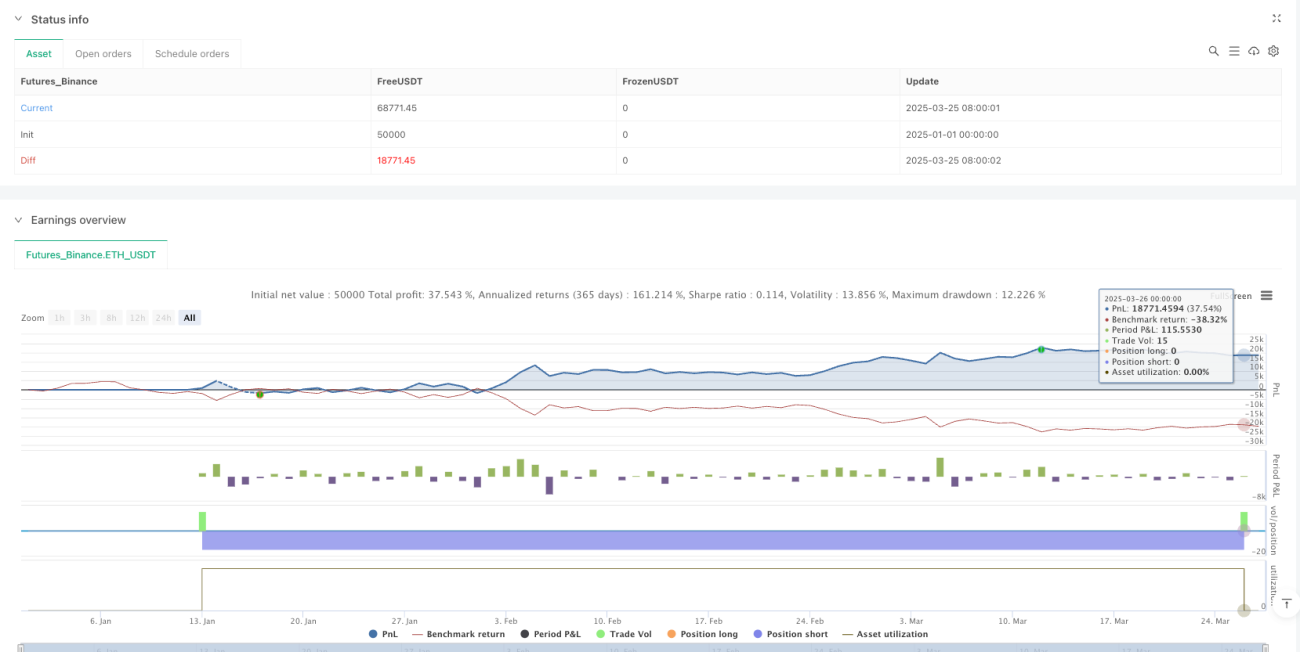
/*backtest
start: 2025-01-01 00:00:00
end: 2025-03-27 00:00:00
period: 2d
basePeriod: 2d
exchanges: [{"eid":"Futures_Binance","currency":"ETH_USDT"}]
*/

//@version=6
strategy("Vishal Strategy", overlay=true, margin_long=100, margin_short=100, initial_capital=100000, default_qty_type=strategy.percent_of_equity, default_qty_value=100)

// **MACD Inputs & Calculation**- 1