
Strategy Overview
This is an intelligent trading strategy that combines Bollinger Bands and SuperTrend indicators. The strategy primarily uses Bollinger Bands to identify market volatility ranges while utilizing the SuperTrend indicator to confirm market trend direction, enabling trades at high-probability positions. The strategy is designed for various trading instruments and timeframes, performing particularly well on 30-minute and 2-hour timeframes.
Strategy Principles
The core logic of the strategy is based on the following key elements:
- Uses 20-period Bollinger Bands with 2 standard deviations bandwidth, constructing upper, middle, lower bands, and two median lines
- Employs 10-period ATR and factor of 3 to calculate the SuperTrend indicator
- Entry signals:
- Long entry: When price touches the lower Bollinger Band and SuperTrend indicates bullish direction
- Short entry: When price touches the upper Bollinger Band and SuperTrend indicates bearish direction
- Exit signals:
- Long exit: When closing price breaks below the SuperTrend line and trend turns bearish
- Short exit: When closing price breaks above the SuperTrend line and trend turns bullish
Strategy Advantages
- Dual confirmation mechanism increases trade reliability: Combining Bollinger Bands' volatility range and SuperTrend's direction judgment effectively reduces false breakout risks
- Adaptive to market volatility: Bollinger Bands automatically adjust bandwidth based on market volatility, providing good adaptability
- Clear trading signals: Entry and exit conditions are explicit, easy to execute and backtest
- Flexible parameter settings: Can adjust Bollinger Bands length, bandwidth multiplier, and SuperTrend parameters based on different market conditions
- Excellent visualization: Uses different colors and shapes to mark trading signals, convenient for analysis and monitoring
Strategy Risks
- Choppy market risk: May generate frequent false signals in sideways markets
- Lag risk: Both Bollinger Bands and SuperTrend are lagging indicators, may miss optimal entry points in fast-moving markets
- Parameter sensitivity: Different parameter settings may lead to significant performance variations
Recommended risk controls:
- Set stop-loss positions to control single-trade risk
- Consider pausing trading during extreme volatility periods
- Regularly optimize parameters to adapt to market changes
Strategy Optimization Directions
- Add market volatility filtering:
- Adjust position sizes in high volatility environments
- Add ATR filter to avoid trading during excessive volatility
- Improve profit-taking and stop-loss mechanisms:
- Dynamically set stop-loss positions based on Bollinger Band width
- Design dynamic profit-taking strategy based on SuperTrend slope
- Add time filtering:
- Avoid important data release times
- Set different parameters for different time periods
- Optimize signal confirmation mechanism:
- Add volume confirmation
- Consider adding trend strength indicators
Summary
This is a complete trading system combining classic technical analysis indicators, which can perform well in both trending and volatile markets through the synergy of Bollinger Bands and SuperTrend. The strategy's visualization design and parameter flexibility make it highly practical. Through the suggested optimization directions, the strategy's stability and profitability can be further enhanced. It is recommended to conduct thorough backtesting and parameter optimization before live trading.
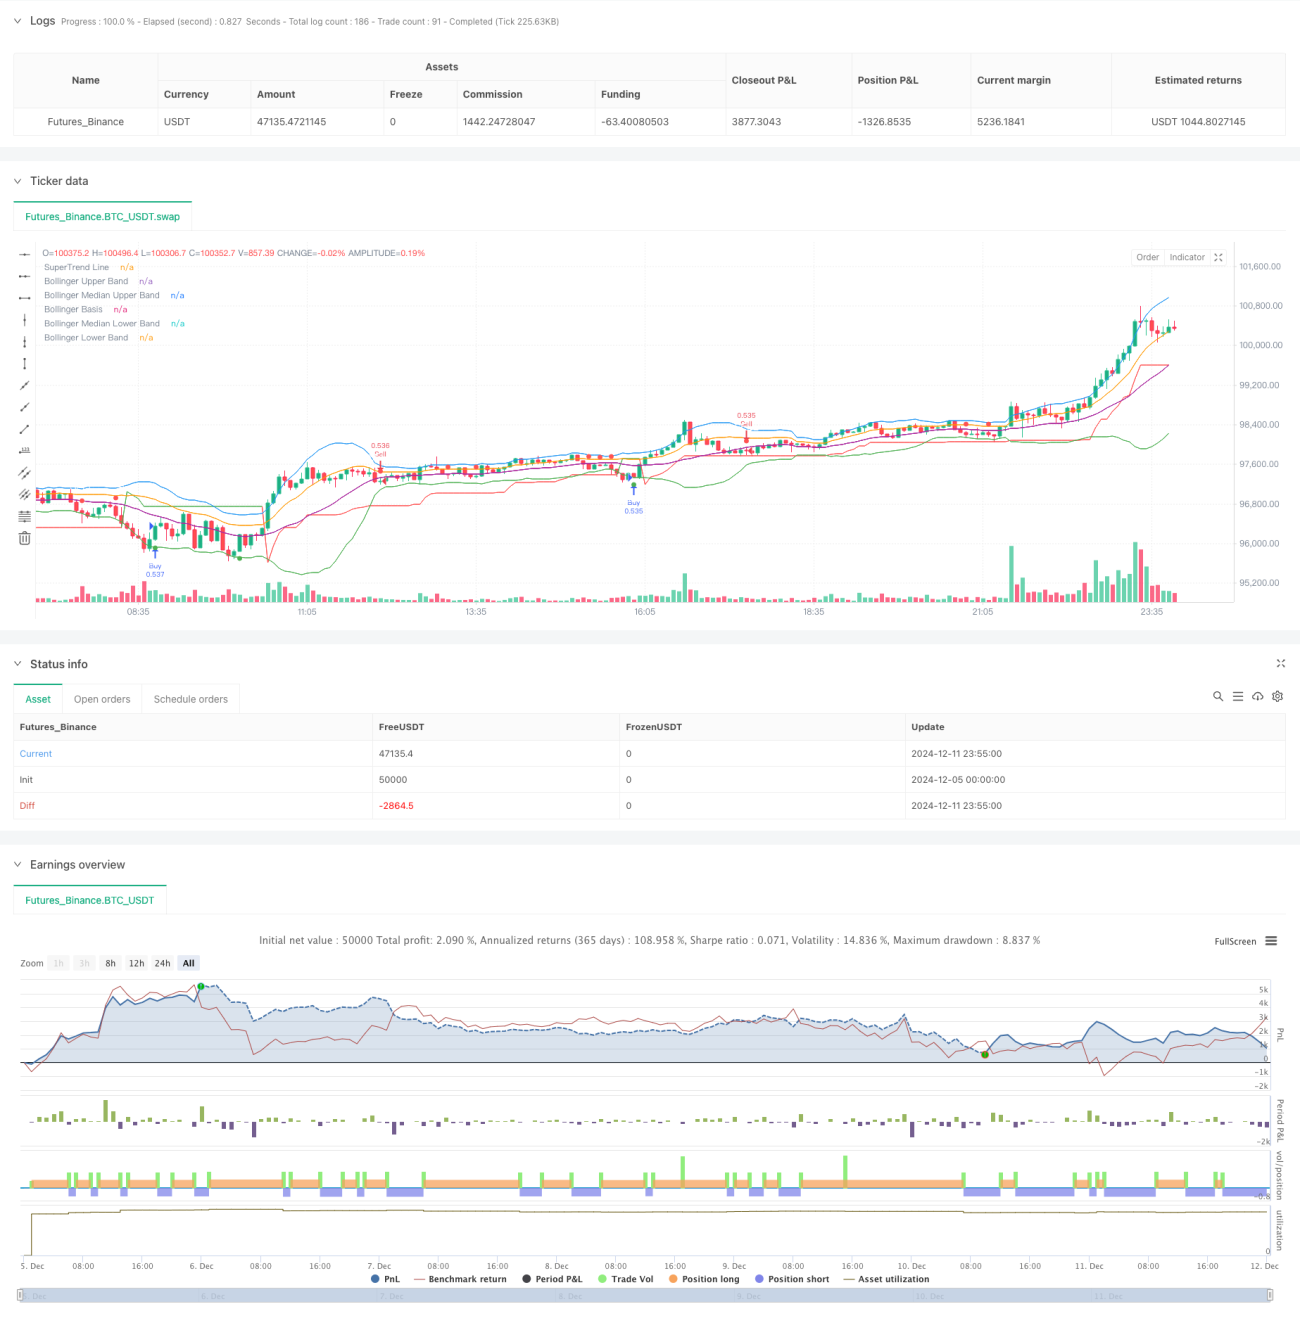
/*backtest
start: 2024-12-05 00:00:00
end: 2024-12-12 00:00:00
period: 5m
basePeriod: 5m
exchanges: [{"eid":"Futures_Binance","currency":"BTC_USDT"}]
*/

//@version=5
strategy("Bollinger Band & SuperTrend Strategy (Standard Chart)", overlay=true, default_qty_type=strategy.percent_of_equity, default_qty_value=100)

// Bollinger Bands Settings- 1