
Overview
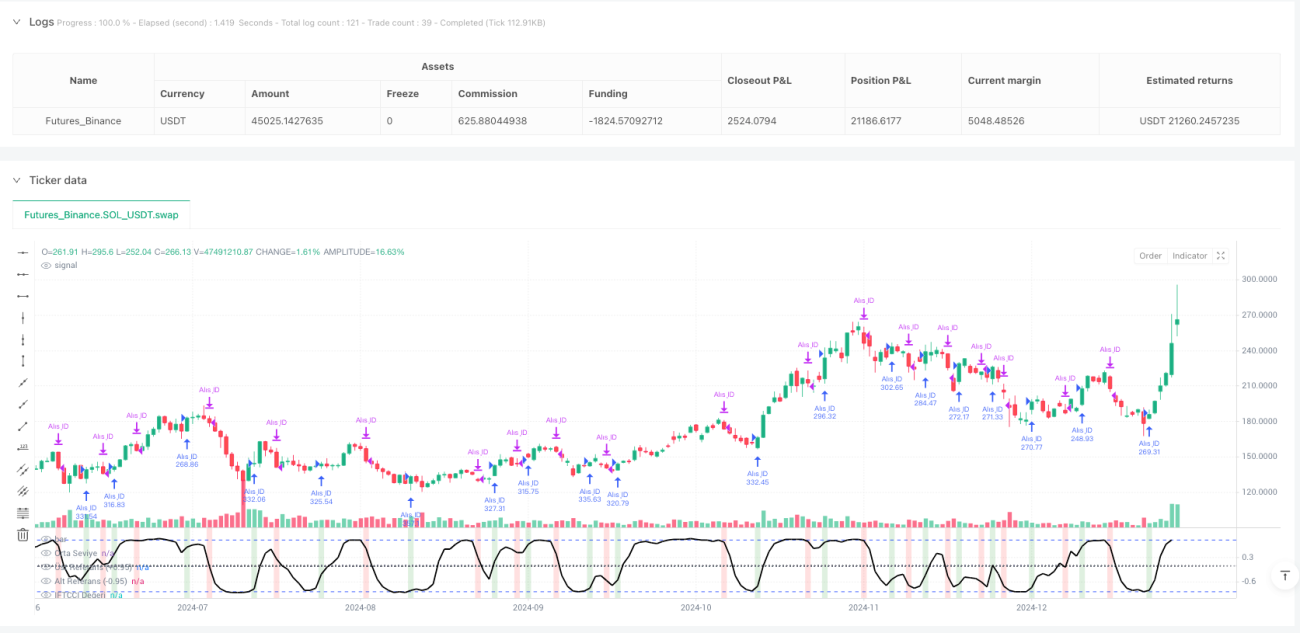
The Adaptive Inverse Hyperbolic Tangent CCI Momentum Trading Strategy is a quantitative trading system based on technical indicators, centered around the IFTCCI indicator developed by Kıvanc Özbilgiç. This strategy generates buy and sell signals by setting precise threshold levels as the indicator oscillates between -1 and +1. Buy signals are triggered when the indicator crosses upward from below -0.95 to above a specific threshold; sell signals are triggered when the indicator crosses downward from above 0.95 to below a specific threshold. Additionally, the strategy incorporates a dynamic stop-loss mechanism and re-entry conditions: if the price moves in the opposite direction by a certain magnitude (0.1 units) after a signal is generated, the system will trigger a stop-loss or execute a re-entry operation. This strategy performs more effectively on Heikin Ashi charts, providing traders with a systematic approach to momentum trading.
Strategy Principles
The core of this strategy is the IFTCCI indicator, which is calculated through the following steps:
- First, calculate the standard CCI indicator and divide it by 4 for initial normalization
- Multiply the normalized CCI value by 0.1 to adjust sensitivity
- Apply a Weighted Moving Average (WMA) for smoothing
- Finally, map the values to a range between -1 and +1 using the hyperbolic tangent function (tanh)
The specific calculation formula is:
v1 = 0.1 * (CCI(close, period) / 4)
v2 = WMA(v1, wma_period)
IFTCCI = (e^(2*v2) - 1) / (e^(2*v2) + 1)
The execution logic of the strategy is divided into the following key components:
-
Buy Conditions:
- Main buy signal: Triggered when the IFTCCI indicator rises from below -0.95 to above -0.94
- Re-entry buy signal: Triggered when the indicator rises at least 0.1 units from its lowest point
-
Sell Conditions:
- Target sell: Triggered when the IFTCCI indicator falls from above 0.95 to below 0.94
- Stop-loss sell: Triggered when the indicator falls at least 0.1 units from the highest point during the holding period
-
State Tracking:
- Records the highest indicator value during the holding period for stop-loss calculations
- Tracks the lowest indicator value after position closure for re-entry judgment
The entire strategy employs percentage-based fund management, using 100% of available funds for each trade, and prohibits pyramiding (pyramiding=0). The strategy calculates signals in real-time as each candle forms (calc_on_every_tick=true), ensuring timely capture of market dynamics.
Strategy Advantages
-
Clear Entry and Exit Rules: The strategy provides explicit trading signals based on precise numerical thresholds, avoiding subjective judgment and making trading decisions more objective and disciplined.
-
Dynamic Risk Management Mechanism: The built-in stop-loss mechanism effectively limits losses on individual trades, automatically exiting when the market moves against the position beyond a preset magnitude, protecting capital safety.
-
Strong Market Adaptability: The IFTCCI indicator, through hyperbolic tangent transformation, oscillates between -1 and +1, possessing inherent normalization characteristics suitable for market environments with different volatility levels.
-
Smoothed Signals, Reduced False Breakouts: Using weighted moving averages to smooth the original CCI effectively reduces noise and false signals, improving the reliability of trading signals.
-
Intelligent Re-entry Mechanism: When the market resumes its original trend after an exit, the re-entry mechanism allows the system to recapture opportunities, enhancing the strategy's profitability.
-
Good Visualization: The strategy displays clear background color changes on the chart, helping traders intuitively understand market conditions and trading signals.
-
Parameter Adjustability: All key parameters can be adjusted through the input interface, allowing the strategy to adapt to different market conditions and personal risk preferences.
Strategy Risks
-
Frequent Trading in Oscillating Markets: In range-bound markets, the indicator may frequently fluctuate around the thresholds, generating multiple buy and sell signals, leading to overtrading and commission erosion.
Solution: Additional filtering conditions can be added, such as time filters or trend filters, to reduce trading frequency in oscillating markets. -
Fixed Stop-Loss Magnitude Issue: The current strategy uses a fixed value (0.1 units) as the stop-loss magnitude, which may be too large or too small in market environments with different volatility levels.
Solution: Design an adaptive stop-loss magnitude that dynamically adjusts the stop-loss distance based on recent market volatility. -
Lack of Long-term Trend Confirmation: This strategy is primarily based on short-term momentum and does not incorporate long-term trend analysis, potentially generating unnecessary trades when the main trend reverses.
Solution: Introduce long-period trend indicators as filters, only trading in the direction of the trend. -
Timing Risk of Re-entry Mechanism: The current re-entry mechanism is based on a fixed rebound magnitude and may re-enter too early during market false breakouts.
Solution: Add additional confirmation conditions, such as volume confirmation or complementary signals from other technical indicators. -
Single Indicator Dependency: The strategy relies solely on the IFTCCI indicator for decision-making, lacking multi-dimensional market analysis.
Solution: Introduce complementary indicator combinations, such as RSI, MACD, or volatility indicators, to provide multi-angle market confirmation.
Optimization Directions
-
Multiple Timeframe Analysis Integration:
The current strategy operates on a single timeframe. It could integrate multiple timeframe analysis, for example, using the IFTCCI indicator from a higher timeframe as a trading direction filter, only trading in the direction of the larger trend. This can reduce counter-trend trading and improve win rates. -
Dynamic Threshold Adjustment:
Change the fixed thresholds (-0.95/0.95) to thresholds that dynamically adjust based on market volatility. Use narrower thresholds in low-volatility environments and wider thresholds in high-volatility environments to adapt to signal generation needs under different market conditions. -
Volume Confirmation Mechanism:
Add a volume analysis component, requiring significant volume support when signals are generated. This can filter out low-quality breakout signals and reduce losses from false breakouts. -
Fund Management Optimization:
The current strategy uses a fixed percentage for position management. This could be improved to an adaptive fund management system based on market volatility and win rates, increasing positions on high-confidence signals and reducing positions on low-confidence signals. -
Machine Learning Enhancement:
Use machine learning algorithms to adaptively optimize the parameters of the IFTCCI indicator (CCI period and WMA period), automatically adjusting the best parameter combinations according to different market environments to improve the strategy's adaptability. -
Trading Time Filter:
Add a trading time filter to avoid high-volatility periods at market open and close, or avoid periods when important economic data is released, reducing unpredictable volatility caused by sudden events. -
Correlation Analysis:
Introduce correlation analysis with other markets or assets, enhancing the credibility of trading signals when multiple related markets simultaneously show similar signals, improving the robustness of the strategy.
Conclusion
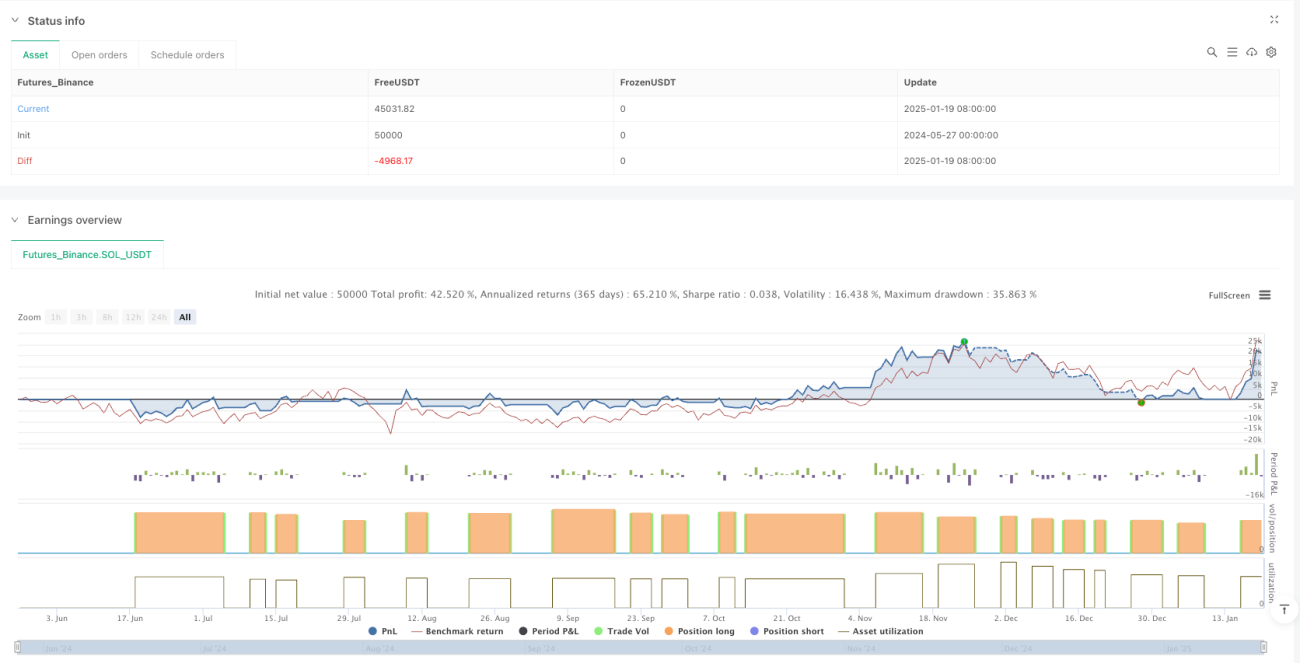
The Adaptive Inverse Hyperbolic Tangent CCI Momentum Trading Strategy is a well-structured, logically clear quantitative trading system that generates trading signals through threshold breakouts of the IFTCCI indicator and is equipped with stop-loss and re-entry mechanisms to manage risk and capture opportunities. The main advantages of the strategy lie in its clear signals, dynamic risk control, and strong parameter adjustability.
However, the strategy also faces risks such as frequent trading in oscillating markets, inflexible fixed stop-loss magnitudes, and lack of long-term trend confirmation. By integrating multiple timeframe analysis, dynamically adjusting thresholds, adding volume confirmation, optimizing fund management, introducing machine learning enhancements, and adding trading time filters, the robustness and profitability of the strategy can be significantly improved.
For traders wishing to apply this strategy, it is recommended to first test different parameter combinations in a simulated environment to find the optimal settings for their trading instruments and risk preferences, and gradually integrate the optimization directions proposed in this article to build a more comprehensive and robust trading system.
/*backtest
start: 2024-05-27 00:00:00
end: 2025-01-20 00:00:00
period: 1d
basePeriod: 1d
exchanges: [{"eid":"Futures_Binance","currency":"SOL_USDT"}]
*/

// This Pine Script® code is subject to the terms of the Mozilla Public License 2.0 at https://mozilla.org/MPL/2.0/
// © erkankuskonmaz

//@version=5- 1