Momentum Indicator Oscillation Threshold Enhanced Trading Strategy

Overview
This strategy is a momentum trading system based on the Commodity Channel Index (CCI), designed to capture trading opportunities in oversold areas by monitoring price deviations from the mean. The strategy uses a 12-period lookback, enters long positions when CCI drops below -90 threshold, exits when closing price breaks above previous highs, and includes optional stop-loss and take-profit mechanisms.
Strategy Principles
The core principle utilizes CCI to measure price deviation from its mean. CCI calculation involves: first computing typical price (arithmetic mean of high, low and close prices), then calculating Simple Moving Average (SMA) of typical price, finally deriving CCI by subtracting SMA from typical price, dividing by mean deviation and multiplying by 0.015. Long positions are entered when CCI falls below -90, indicating possible oversold conditions; positions are closed when price breaks above previous highs, confirming upward trend. The strategy offers customizable stop-loss and take-profit parameters to accommodate different risk preferences.
Strategy Advantages
- Clear Signals: Uses fixed CCI thresholds for entry signals, avoiding indecision from subjective judgment
- Controlled Risk: Achieves precise risk control through optional stop-loss and take-profit mechanisms
- Flexible Parameters: Traders can adjust CCI lookback period and entry threshold for different market conditions
- Simple Execution: Clear strategy logic, easy to understand and implement, suitable for all trader types
- Cost Efficient: Event-driven trading approach reduces costs from overtrading
Strategy Risks
- False Breakout Risk: CCI crossing threshold may result in false breakouts leading to unnecessary trades
- Slippage Impact: May face significant slippage losses during high market volatility
- Trend Dependency: Strategy may generate frequent false signals in ranging markets
- Parameter Sensitivity: CCI period and threshold choices significantly impact strategy performance
- Delay Risk: As a lagging indicator, CCI may miss optimal entry points
Strategy Optimization Directions
- Signal Filtering: Additional technical indicators like RSI or MACD can be introduced to filter false signals
- Dynamic Thresholds: Replace fixed CCI thresholds with volatility-based dynamic thresholds
- Time-based Optimization: Adjust strategy parameters based on different time period characteristics
- Money Management: Add dynamic position sizing mechanisms to improve capital efficiency
- Multi-timeframe Analysis: Incorporate longer-term trend analysis to optimize entry timing
Conclusion
This strategy captures market oversold opportunities through CCI indicator, combined with stop-loss and take-profit mechanisms to create a complete trading system. The strategy features clear logic, easy execution, and good risk control capabilities. Through optimization measures like signal filtering and dynamic thresholds, the strategy's stability and profitability can be further improved. Traders are advised to conduct thorough backtesting and adjust parameters according to specific market characteristics before live implementation.
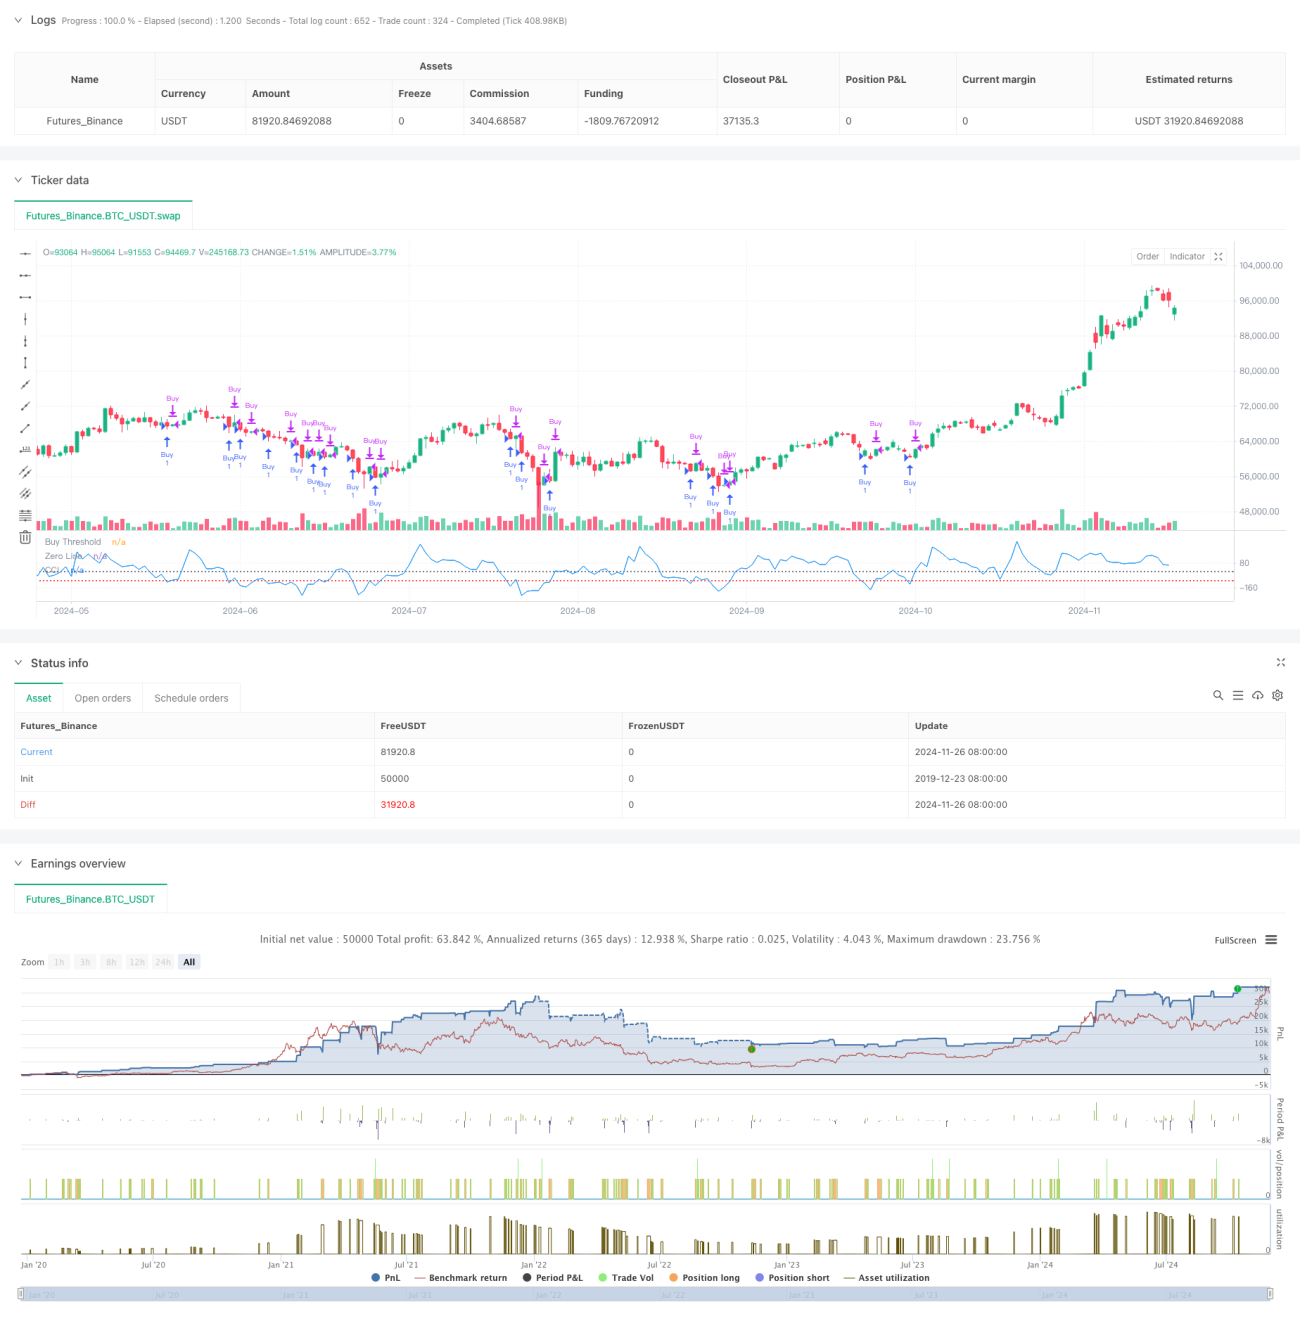
/*backtest
start: 2019-12-23 08:00:00
end: 2024-11-27 08:00:00
period: 1d
basePeriod: 1d
exchanges: [{"eid":"Futures_Binance","currency":"BTC_USDT"}]
*/

//@version=5
strategy("CCI Threshold Strategy", overlay=false, initial_capital=50000, pyramiding=0, commission_type=strategy.commission.cash_per_contract, commission_value=0.05, slippage=1)

// --- Input Parameters ---- 1