
概述
零滞后MACD与云图均线动量整合交易系统是一种专为快节奏市场环境设计的量化交易策略,该策略巧妙地整合了三个不同特性的技术指标:零滞后MACD(Zero Lag MACD)、一目均衡图的基准线(Kijun-sen)以及移动便利指标(Ease of Movement,EOM)。这三个指标相互协同工作,在确认交易信号时提供多层次的验证,显著提高了信号质量和可靠性。该策略特别适用于加密货币等波动较大的市场,并且在低时间周期(如5分钟)内表现出色。
该策略的核心设计理念是仅在多重条件同时满足的情况下才触发交易信号,从而过滤掉低质量的交易机会,减少错误信号,并通过动态的止损和固定的盈亏比来实现稳健的风险管理。通过参数优化和条件筛选,该策略能够适应不同市场环境,为交易者提供高概率的交易机会。
策略原理
零滞后MACD与云图均线动量整合交易系统的运作基于三个核心指标的协同作用:
-
零滞后MACD(增强版1.2):与传统MACD相比,零滞后MACD通过特殊计算方法减少了信号滞后性,提高了对趋势转折点的敏感度。该指标在策略中用于捕捉精确的动量变化,其计算过程包括:
- 快线和慢线的零滞后计算:
zerolagEMA = (2 * ma1) - ma2和zerolagslowMA = (2 * mas1) - mas2 - MACD线:快线与慢线的差值
- 信号线:MACD的平滑移动平均
- 柱状图:MACD线与信号线的差值
- 快线和慢线的零滞后计算:
-
一目均衡图基准线(Kijun-sen):作为动态支撑/阻力和趋势过滤器,Kijun-sen线用于确认市场主导方向。其计算基于唐奇安通道原理,取特定周期内的最高价和最低价的平均值:
baseLine = math.avg(ta.lowest(basePeriods), ta.highest(basePeriods))
-
移动便利指标(EOM):这是一个基于成交量的振荡器,通过测量价格变动的难易程度来确认价格走势。EOM通过以下公式计算:
eom = ta.sma(div * ta.change(hl2) * (high - low) / volume, eom_length)
策略的入场条件组合了这三个指标的信号:
多头入场条件:
- MACD线上穿信号线(
ta.crossover(ZeroLagMACD, signal)) - MACD线低于柱状图(
ZeroLagMACD < hist) - 价格高于Kijun-sen(
close > baseLine) - EOM大于零(
eom > 0)
空头入场条件:
- MACD线下穿信号线(
ta.crossunder(ZeroLagMACD, signal)) - MACD线高于柱状图(
ZeroLagMACD > hist) - 价格低于Kijun-sen(
close < baseLine) - EOM小于零(
eom < 0)
在风险管理方面,策略采用了基于ATR的动态止损,止损距离为当前ATR的2.5倍,并设置固定的风险回报比为1:1.2,确保每笔交易有合理的盈利目标。
策略优势
-
多重确认系统:通过整合三个具有不同特性的指标(趋势、动量和成交量),策略能够有效过滤假信号,仅在高概率的交易机会出现时才入场,大幅提高了交易成功率。
-
减少滞后性:采用零滞后MACD而非传统MACD,能够更早地捕捉市场转折点,减少传统指标常见的滞后问题,使交易者能够更接近理想入场点。
-
适应性强:策略中的所有参数都可以根据不同的市场环境、交易品种和时间周期进行自定义调整,使其具有极强的适应性。核心指标包括MACD周期参数、Kijun-sen周期、EOM长度等都可以针对性优化。
-
完善的风险管理机制:
- 动态止损设计(基于ATR的波动率自适应)确保止损位置能够根据市场波动性自动调整
- 固定风险回报比(1:1.2)提供了一致的盈利预期
- 策略仅在多重条件同时满足时才开仓,显著降低了错误信号的风险
-
全方位市场分析:策略同时考量了价格动量(MACD)、价格结构(Kijun-sen)和成交量确认(EOM),从多个维度分析市场,形成了更全面的交易决策系统。
-
可视化功能:策略提供了丰富的可视化选项,包括信号标记、指标线显示和信息面板,帮助交易者直观地理解和监控交易信号和当前市场状态。
策略风险
-
假信号风险:尽管策略使用多重指标确认,但在高波动或盘整市场中,仍可能出现假信号。特别是当市场在短时间内频繁变动方向时,多重指标的确认可能导致交易信号过少,错失部分交易机会。
- 解决方法:可以根据市场状态调整指标参数,在高波动期间可能需要放宽某些条件或调整MACD和EOM的敏感度。
-
参数优化挑战:策略有多个参数需要调整(MACD参数、Kijun-sen周期、EOM长度等),不当的参数设置可能导致过度拟合历史数据,而在未来市场环境中表现不佳。
- 解决方法:采用前向测试和稳健性测试,确保参数在不同市场环境下都能保持有效性;避免过度优化,寻找在多种市场条件下表现稳定的参数组合。
-
滑点和流动性风险:在低时间周期交易中,特别是针对加密货币等波动较大的市场,可能面临滑点和流动性问题,导致实际执行价格与策略计算价格存在差异。
- 解决方法:在回测中纳入滑点模拟;考虑在策略中增加流动性过滤条件;优先选择流动性较好的市场进行交易。
-
止损被击穿风险:在快速波动的市场中,基于ATR的止损可能无法应对极端价格变动,导致实际损失超过预期。
- 解决方法:考虑增加额外的止损保护机制,例如在极端波动条件下自动调整ATR乘数或设置绝对最大损失限制。
-
技术依赖性:策略高度依赖技术指标,在基本面变化导致的市场剧烈波动情况下,可能表现不佳。
- 解决方法:在重要经济数据或事件发布前减少交易规模或暂停交易;考虑整合基本面过滤器。
策略优化方向
-
指标参数自适应:当前策略使用固定的指标参数,可以考虑实现参数的自适应调整机制,根据市场波动性或交易周期自动优化MACD、Kijun-sen和EOM的参数。这将使策略能够更好地适应不同市场阶段,提高整体稳定性。
- 可以基于最近N个周期的波动率或趋势强度动态调整参数
- 研究不同市场状态(趋势、震荡)下最优参数组合,并构建切换机制
-
增加市场状态分类:通过增加市场状态识别模块,策略可以根据当前市场是处于趋势还是震荡状态来调整交易条件和风险管理参数。例如:
- 在震荡市场中增加过滤条件或降低交易频率
- 在明确趋势中可以放宽某些入场条件,同时延长持仓时间
- 考虑添加ADX等趋势强度指标来帮助识别市场状态
-
优化止盈策略:当前策略使用固定的风险回报比(1:1.2)设置止盈,可以考虑实现更灵活的止盈机制,如:
- 部分止盈策略:在达到一定盈利后移动止损到成本价,让部分利润继续运行
- 基于技术水平(如支撑/阻力位、斐波那契水平)的动态止盈
- 利用ATR波动率设置动态止盈目标,在不同波动环境下自动调整盈利目标
-
整合机器学习模型:考虑使用机器学习技术来增强策略的预测能力:
- 使用机器学习算法分析历史模式,预测信号的成功概率
- 基于历史表现构建交易信号的质量分类系统
- 利用深度学习模型识别更复杂的市场模式
-
添加时间过滤器:市场在不同时间段的行为特征可能有所不同,增加时间过滤器可以避免在低效交易时段进行交易:
- 根据历史数据分析不同时间段的交易成功率
- 在波动性过低或过高的时段暂停交易
- 考虑不同市场的交易时段特性,例如针对加密货币市场的24小时交易特性进行优化
总结
零滞后MACD与云图均线动量整合交易系统是一个设计精良的量化交易策略,通过整合零滞后MACD、Kijun-sen和EOM三个技术指标,形成了一套多维度的交易信号确认系统。该策略在入场点识别上采用了严格的多重确认机制,在风险管理上结合了动态止损和固定风险回报比,实现了交易过程的全方位控制。
策略的核心优势在于其减少滞后性的设计理念和多指标协同工作的机制,这使其能够在快速变化的市场中捕捉高概率的交易机会。同时,完全可自定义的参数设置使交易者能够根据不同市场环境和个人风险偏好进行灵活调整。
虽然该策略存在一些潜在风险,如参数优化挑战和假信号风险,但通过建议的优化方向——如指标参数自适应、市场状态分类和机器学习整合等,可以进一步提升策略的稳健性和适应性。
总体而言,这是一个理念先进、结构完整的量化交易系统,适合有一定技术分析基础的交易者使用,特别是在追求高质量交易信号而非高频交易的投资者。通过合理的参数调整和持续优化,该策略有潜力在各种市场环境中提供稳定的交易表现。
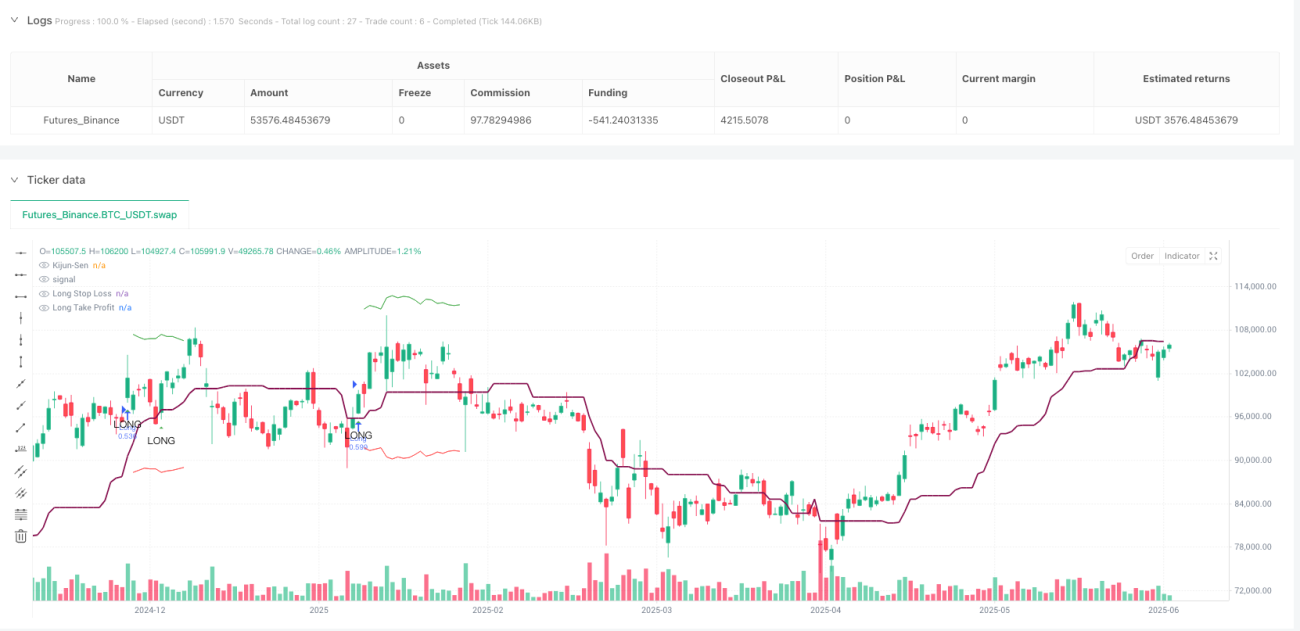
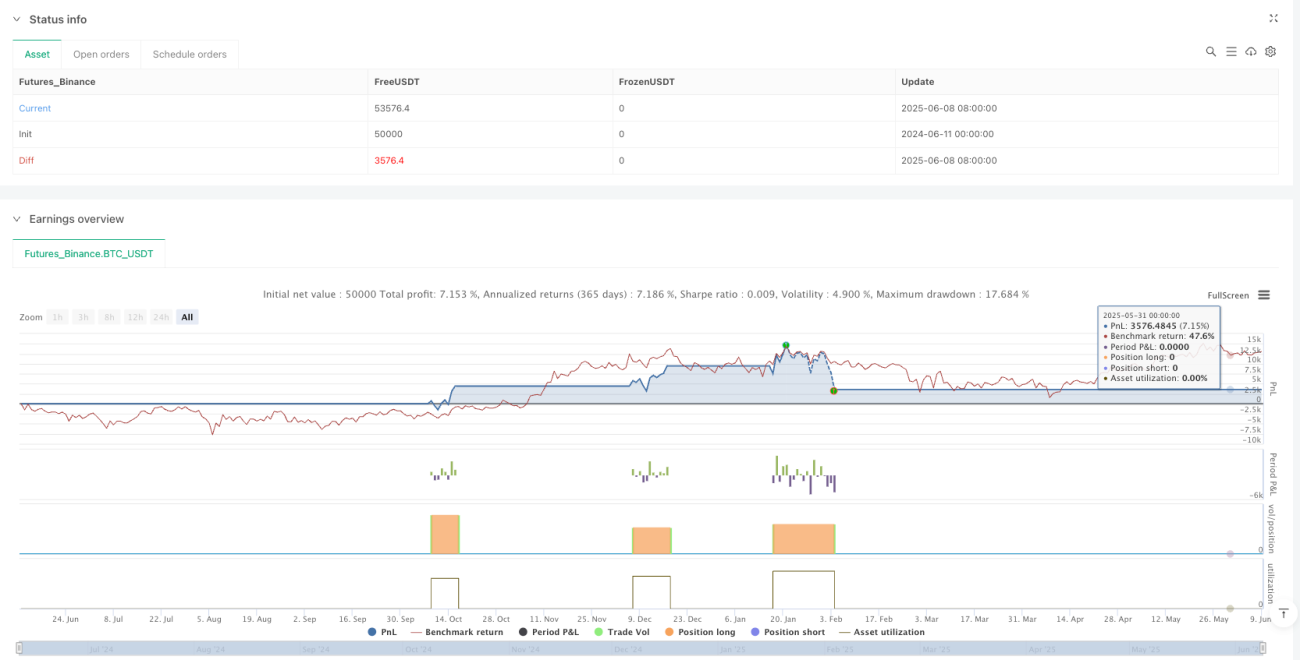
/*backtest
start: 2024-06-11 00:00:00
end: 2025-06-09 08:00:00
period: 1d
basePeriod: 1d
exchanges: [{"eid":"Futures_Binance","currency":"BTC_USDT"}]
*/

//@version=6
strategy(title="Zero Lag MACD + Kijun-sen + EOM Strategy", shorttitle="ZL-KJ-EOM", overlay=true, default_qty_type=strategy.percent_of_equity, default_qty_value=100)

// ================================================================================- 1