波动率优化的RSI均值回归交易策略

RSI MA SMA MR RSI均值回归 波动率优化 趋势分析 止损策略 盈利目标 风险管理
创建日期: 2025-06-23 10:40:11 最后修改: 2025-06-23 10:40:11
复制: 0 点击次数: 58
avatar of ianzeng123 ianzeng123
2
关注
68
关注者

波动率优化的RSI均值回归交易策略 波动率优化的RSI均值回归交易策略

概述

波动率优化的RSI均值回归交易策略是一种结合了RSI(相对强弱指标)均值回归信号、智能市场过滤和波动率自适应风险管理的量化交易策略。该策略主要识别RSI达到极端水平时的高概率反转机会(RSI≤30为超卖,RSI≥70为超买),但仅在市场条件有利于均值回归策略时进行交易。通过深入分析代码,我们可以看出该策略的核心在于结合技术指标和市场状态分析,以优化交易决策并最大化不同市场条件下的表现。

策略原理

波动率优化的RSI均值回归交易策略的原理基于以下几个关键组件:

  1. RSI信号系统:使用14周期RSI指标识别市场的超买超卖状态。当RSI低于30时,市场被视为超卖状态,产生买入信号;当RSI高于70时,市场被视为超买状态,产生卖出信号。

  2. 趋势分析:策略使用50周期简单移动平均线(SMA)来确定市场方向。价格高于移动平均线表示上升趋势,价格低于移动平均线表示下降趋势。更重要的是,策略计算趋势强度,避免在强趋势市场中(趋势强度>25%)交易,因为均值回归策略在这些条件下通常表现不佳。

  3. 市场适应性分析:代码计算近期波动率,确保市场波动足够大(日波动率>1%)以支持均值回归策略。策略还检查趋势强度是否在可接受范围内(≤25%)。只有当市场条件满足这些标准时,策略才会考虑入场交易。

  4. 风险管理:策略实施20%的止损,为波动性资产提供足够的价格波动空间,同时设置20%的盈利目标,确保1:1的风险/回报比率。每笔交易使用5%的资金,允许最多两个头寸的金字塔式加仓,以便在强势设置中扩大头寸。

  5. 信号确认与退出:入场信号需要RSI达到极值并且市场条件适合。退出条件包括RSI反转(达到相反的极值)、止损触发或盈利目标达成。

策略优势

通过深入剖析代码,该策略展现出以下显著优势:

  1. 市场环境适应性:与基础RSI策略不同,此策略通过市场状态分析过滤交易信号,避免在不适合均值回归策略的市场环境中交易,大幅提高了信号质量。

  2. 波动率自适应风险管理:设置20%的止损水平,专为波动性资产设计,避免了由于正常市场波动而过早退出的情况,同时提供足够的防护措施。

  3. 精确的入场条件:结合RSI极值、趋势分析和波动率检查,确保仅在高概率设置中入场,减少虚假信号。

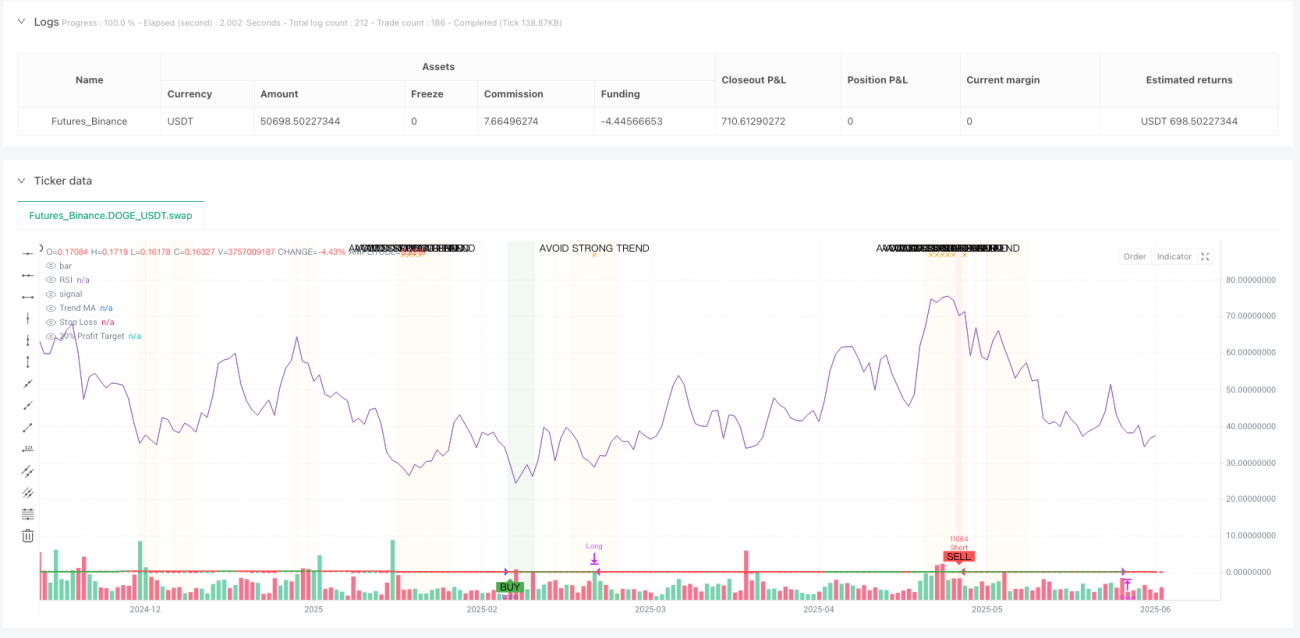
  4. 可视化决策支持:策略提供背景色变化(绿色背景表示适合买入区域,红色背景表示适合卖出区域)和警告标签(橙色警告表示检测到强趋势,应避免交易),增强了交易决策的直观性。

  5. 自动化友好:内置完整的警报条件系统,支持自动化交易执行,无需人工监控市场。

  6. 动态信息表:实时显示市场状况和交易状态,包括当前RSI值、趋势强度、波动率和市场适应性评估,为交易者提供全面的市场视角。

策略风险

尽管该策略设计合理,但仍存在一些潜在风险:

  1. 参数敏感性:策略性能高度依赖于输入参数,如RSI长度、超买超卖水平、最大趋势强度和波动率阈值。不同市场环境可能需要不同的参数优化,错误的参数可能导致策略表现不佳。

  2. 极端市场条件:在市场崩盘或极端波动期间,即使设置了20%的止损,策略也可能面临滑点风险,导致实际损失超过预期。

  3. 资金分配风险:默认每笔交易使用5%的资金,并允许最多两个头寸(共10%),这对某些交易者来说可能过于激进,尤其是在市场波动较大时。

  4. 趋势判断的时滞性:使用50周期移动平均线判断趋势可能引入滞后性,导致在趋势刚刚改变时的错误判断。

  5. 过度过滤风险:严格的市场适应性检查(弱趋势+足够波动性)可能过度过滤交易机会,在某些市场环境中导致交易频率过低。

解决方法包括:针对不同市场和时间框架进行参数优化;在极端市场条件下暂停自动交易;根据个人风险承受能力调整资金分配比例;考虑使用更短周期的移动平均线来减少趋势判断的滞后性;适当放宽市场适应性标准以增加交易频率。

策略优化方向

基于代码分析,该策略可以从以下几个方向进行优化:

  1. 动态参数调整:将RSI的超买超卖阈值设计为动态变量,根据历史波动率自动调整。在低波动率环境中使用更窄的阈值范围(如35/65),在高波动率环境中使用更宽的阈值范围(如25/75)。这将使策略能够更好地适应不同的市场状态。

  2. 多时间框架分析:增加多时间框架确认机制,例如在较长时间框架上确认市场状态,在较短时间框架上寻找入场信号。这种方法可以提高信号质量,减少虚假突破。

  3. 动态止损策略:基于ATR(平均真实范围)设置止损水平,而不是固定百分比。这将使止损点更好地适应当前市场波动状况,避免在高波动时期止损过近,或在低波动时期止损过远。

  4. 部分获利机制:实施分阶段获利策略,而不是全部仓位在20%盈利目标时退出。例如,在10%利润时退出50%仓位,在20%利润时退出剩余仓位。这可以锁定部分利润,同时让剩余仓位有潜力获得更大收益。

  5. 季节性和市场周期分析:整合市场季节性和周期分析,在历史上均值回归策略表现更好的时期提高交易频率,在趋势性更强的时期降低交易频率或调整参数。

  6. 机器学习优化:使用机器学习技术动态预测当前市场环境下均值回归策略的成功概率,并据此调整入场标准和仓位大小。这将使策略能够更智能地适应市场变化。

总结

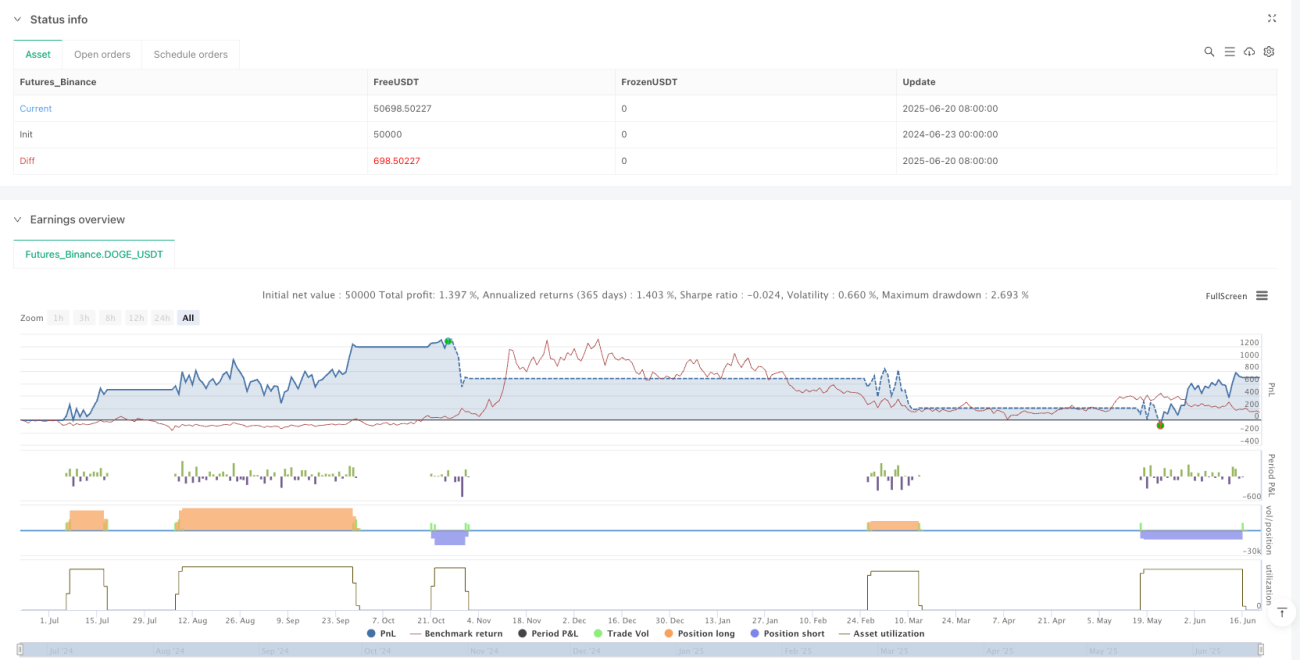
波动率优化的RSI均值回归交易策略是一个全面且智能的交易系统,它解决了基础RSI策略的主要缺点,通过添加市场上下文分析和波动率适应性风险管理,显著提高了策略表现。该策略特别适合具有1%以上日波动率的资产,尤其是在区间震荡或弱趋势市场中。

策略的核心优势在于其智能市场过滤机制,只有在市场条件适合均值回归交易时才生成信号,并通过适当的风险管理措施保护资金。同时,完整的可视化系统和信息表提供了清晰的市场状态概览,支持更明智的交易决策。

尽管存在一些风险和优化空间,但该策略的基础设计是稳健的,通过建议的优化方向,可以进一步提高其在各种市场环境中的适应性和性能。对于寻求在波动性市场中捕捉均值回归机会的交易者来说,这是一个价值的策略框架。

策略源码
/*backtest
start: 2024-06-23 00:00:00
end: 2025-06-21 08:00:00
period: 1d
basePeriod: 1d
exchanges: [{"eid":"Futures_Binance","currency":"DOGE_USDT"}]
*/

// This Pine Script™ code is subject to the terms of the Mozilla Public License 2.0 at https://mozilla.org/MPL/2.0/
// © cindycrijns

//@version=6 
strategy("RSI Mean Reversion", shorttitle="RSI_MR2", overlay=true, initial_capital=10000, default_qty_type=strategy.percent_of_equity, default_qty_value=5, pyramiding=2)

// Input parameters
rsiLength = input.int(14, "RSI Length")
rsiOversold = input.int(30, "RSI Oversold Level")
rsiOverbought = input.int(70, "RSI Overbought Level")
riskPercent = input.float(20.0, "Max Loss Per Trade (%)", minval=1.0, maxval=50.0)
profitTarget = input.float(20.0, "Profit Target (%)", minval=5.0, maxval=100.0)

// Trend analysis parameters
maLength = input.int(50, "Moving Average Length")
trendStrengthPeriod = input.int(20, "Trend Strength Period")
maxTrendStrength = input.float(25.0, "Max Trend Strength % (avoid above this)", minval=5.0, maxval=50.0)

// Calculate indicators
rsi = ta.rsi(close, rsiLength)
ma = ta.sma(close, maLength)

// Trend analysis
trendStrength = math.abs(close - close[trendStrengthPeriod]) / close[trendStrengthPeriod] * 100
isStrongTrend = trendStrength > maxTrendStrength
isUptrend = close > ma
isDowntrend = close < ma
isWeakTrend = trendStrength <= maxTrendStrength

// Market suitability check
priceAboveMA = close > ma
priceBelowMA = close < ma
recentVolatility = ta.stdev(ta.change(close), 20) / close * 100
isVolatileEnough = recentVolatility > 1.0  // At least 1% daily volatility

// Suitability for mean reversion strategy
isSuitableForStrategy = isWeakTrend and isVolatileEnough

// Enhanced RSI signals with trend filtering
longCondition = rsi <= rsiOversold and (isUptrend or isWeakTrend) and isSuitableForStrategy
shortCondition = rsi >= rsiOverbought and (isDowntrend or isWeakTrend) and isSuitableForStrategy

// Exit conditions
longExitCondition = rsi >= rsiOverbought
shortExitCondition = rsi <= rsiOversold

// Prevent overlapping trades
validLong = longCondition and strategy.position_size == 0
validShort = shortCondition and strategy.position_size == 0

// Strategy entries
if validLong
    strategy.entry("Long", strategy.long, comment="RSI Oversold Buy")
    
if validShort
    strategy.entry("Short", strategy.short, comment="RSI Overbought Sell")

// Risk management variables
var float entryPrice = na
var float stopLossPrice = na
var float profitTargetPrice = na

// Set levels when entering a trade
if strategy.position_size != 0 and na(entryPrice)
    entryPrice := strategy.position_avg_price
    stopLossPrice := strategy.position_size > 0 ? entryPrice * (1 - riskPercent/100) : entryPrice * (1 + riskPercent/100)
    profitTargetPrice := strategy.position_size > 0 ? entryPrice * (1 + profitTarget/100) : entryPrice * (1 - profitTarget/100)

// Stop Loss
if strategy.position_size > 0 and close <= stopLossPrice
    strategy.close("Long", comment="Stop Loss")
    entryPrice := na

if strategy.position_size < 0 and close >= stopLossPrice
    strategy.close("Short", comment="Stop Loss")
    entryPrice := na

// Profit Target - Close 100% at 20% profit
if strategy.position_size > 0 and close >= profitTargetPrice
    strategy.close("Long", comment="20% Profit Target")
    entryPrice := na

if strategy.position_size < 0 and close <= profitTargetPrice
    strategy.close("Short", comment="20% Profit Target")
    entryPrice := na

// Signal-based exits (RSI reversal)
if longExitCondition and strategy.position_size > 0
    strategy.close("Long", comment="RSI Exit")
    entryPrice := na

if shortExitCondition and strategy.position_size < 0
    strategy.close("Short", comment="RSI Exit")
    entryPrice := na

// Reset variables when position is closed
if strategy.position_size == 0
    entryPrice := na
    stopLossPrice := na
    profitTargetPrice := na

// Plot moving average and trend analysis
plot(ma, color=isUptrend ? color.green : color.red, linewidth=2, title="Trend MA")
plot(rsi, title="RSI", display=display.none)  // Hidden plot for alerts

// Plot signals
plotshape(validLong, style=shape.labelup, location=location.belowbar, color=color.green, text="BUY", title="Long Signal")
plotshape(validShort, style=shape.labeldown, location=location.abovebar, color=color.red, text="SELL", title="Short Signal")

// Plot risk management levels
plot(strategy.position_size != 0 ? stopLossPrice : na, color=color.red, linewidth=1, title="Stop Loss", style=plot.style_linebr)
plot(strategy.position_size != 0 ? profitTargetPrice : na, color=color.green, linewidth=1, title="20% Profit Target", style=plot.style_linebr)

// Background colors for market conditions
bgcolor(rsi <= rsiOversold and isSuitableForStrategy ? color.new(color.green, 90) : na, title="Good Buy Zone")
bgcolor(rsi >= rsiOverbought and isSuitableForStrategy ? color.new(color.red, 90) : na, title="Good Sell Zone")
bgcolor(isStrongTrend ? color.new(color.orange, 95) : na, title="Strong Trend - Avoid Trading")

// Warning labels for unsuitable conditions
plotshape(isStrongTrend and (rsi <= rsiOversold or rsi >= rsiOverbought), 
          style=shape.xcross, location=location.top, color=color.orange, 
          text="AVOID\nSTRONG TREND", title="Avoid Strong Trend Warning", size=size.small)

plotshape(not isVolatileEnough and (rsi <= rsiOversold or rsi >= rsiOverbought), 
          style=shape.diamond, location=location.top, color=color.gray, 
          text="LOW VOL", title="Low Volatility Warning", size=size.tiny)

// Enhanced info table with market analysis
if strategy.position_size != 0 or not isSuitableForStrategy
    var table infoTable = table.new(position.top_right, 2, 7, bgcolor=color.white, border_width=1)
    table.cell(infoTable, 0, 0, "Position", text_color=color.black, bgcolor=color.gray)
    table.cell(infoTable, 1, 0, strategy.position_size > 0 ? "LONG" : strategy.position_size < 0 ? "SHORT" : "NONE", text_color=color.black)
    table.cell(infoTable, 0, 1, "RSI", text_color=color.black, bgcolor=color.gray)
    table.cell(infoTable, 1, 1, str.tostring(rsi, "#.##"), text_color=color.black)
    table.cell(infoTable, 0, 2, "Trend Strength", text_color=color.black, bgcolor=color.gray)
    table.cell(infoTable, 1, 2, str.tostring(trendStrength, "#.##") + "%", 
               text_color=isStrongTrend ? color.red : color.green)
    table.cell(infoTable, 0, 3, "Volatility", text_color=color.black, bgcolor=color.gray)
    table.cell(infoTable, 1, 3, str.tostring(recentVolatility, "#.##") + "%", 
               text_color=isVolatileEnough ? color.green : color.red)
    table.cell(infoTable, 0, 4, "Market Status", text_color=color.black, bgcolor=color.gray)
    table.cell(infoTable, 1, 4, isSuitableForStrategy ? "GOOD FOR MR" : "AVOID TRADING", 
               text_color=isSuitableForStrategy ? color.green : color.red)
    table.cell(infoTable, 0, 5, "Target", text_color=color.black, bgcolor=color.gray)
    table.cell(infoTable, 1, 5, strategy.position_size != 0 ? str.tostring(profitTargetPrice, "#.###") : "N/A", text_color=color.green)
    table.cell(infoTable, 0, 6, "P&L", text_color=color.black, bgcolor=color.gray)
    table.cell(infoTable, 1, 6, strategy.position_size != 0 ? str.tostring(strategy.openprofit, "#.##") : "N/A", 
               text_color=strategy.openprofit >= 0 ? color.green : color.red)

// Alert conditions for automated trading
alertcondition(validLong, title="RSI Buy Signal", 
               message='BUY {{ticker}} at {{close}} - RSI: {{plot_0}} - Strategy: RSI_MR')

alertcondition(validShort, title="RSI Sell Signal", 
               message='SELL {{ticker}} at {{close}} - RSI: {{plot_0}} - Strategy: RSI_MR')

alertcondition(strategy.position_size > 0 and close >= profitTargetPrice, title="Long Profit Target", 
               message='CLOSE LONG {{ticker}} at {{close}} - Profit Target Hit')

alertcondition(strategy.position_size < 0 and close <= profitTargetPrice, title="Short Profit Target", 
               message='CLOSE SHORT {{ticker}} at {{close}} - Profit Target Hit')

alertcondition(strategy.position_size > 0 and close <= stopLossPrice, title="Long Stop Loss", 
               message='CLOSE LONG {{ticker}} at {{close}} - Stop Loss Hit')

alertcondition(strategy.position_size < 0 and close >= stopLossPrice, title="Short Stop Loss", 
               message='CLOSE SHORT {{ticker}} at {{close}} - Stop Loss Hit')
相关推荐