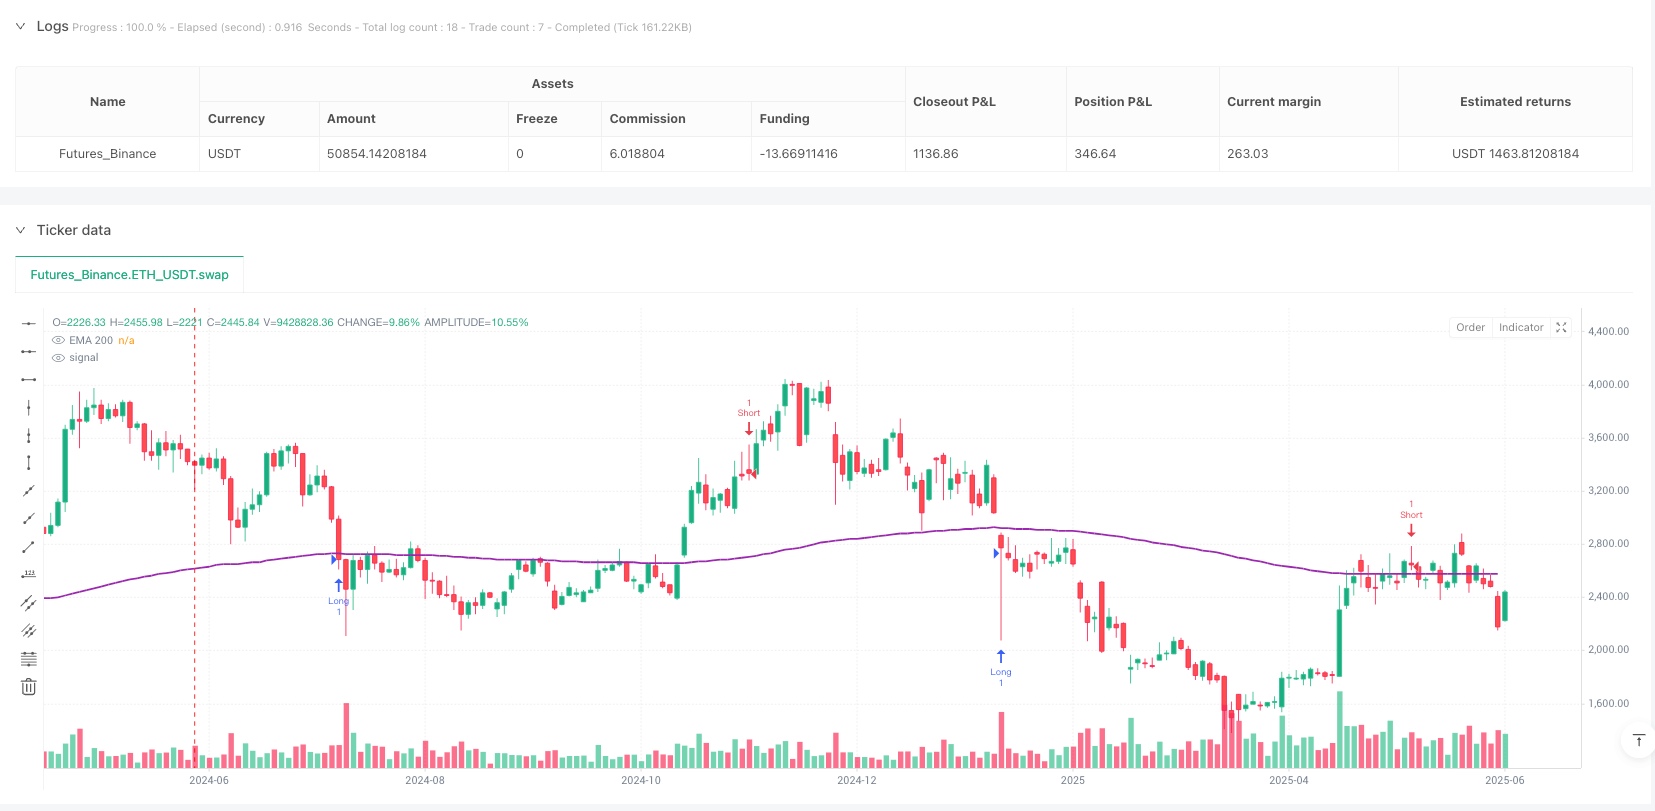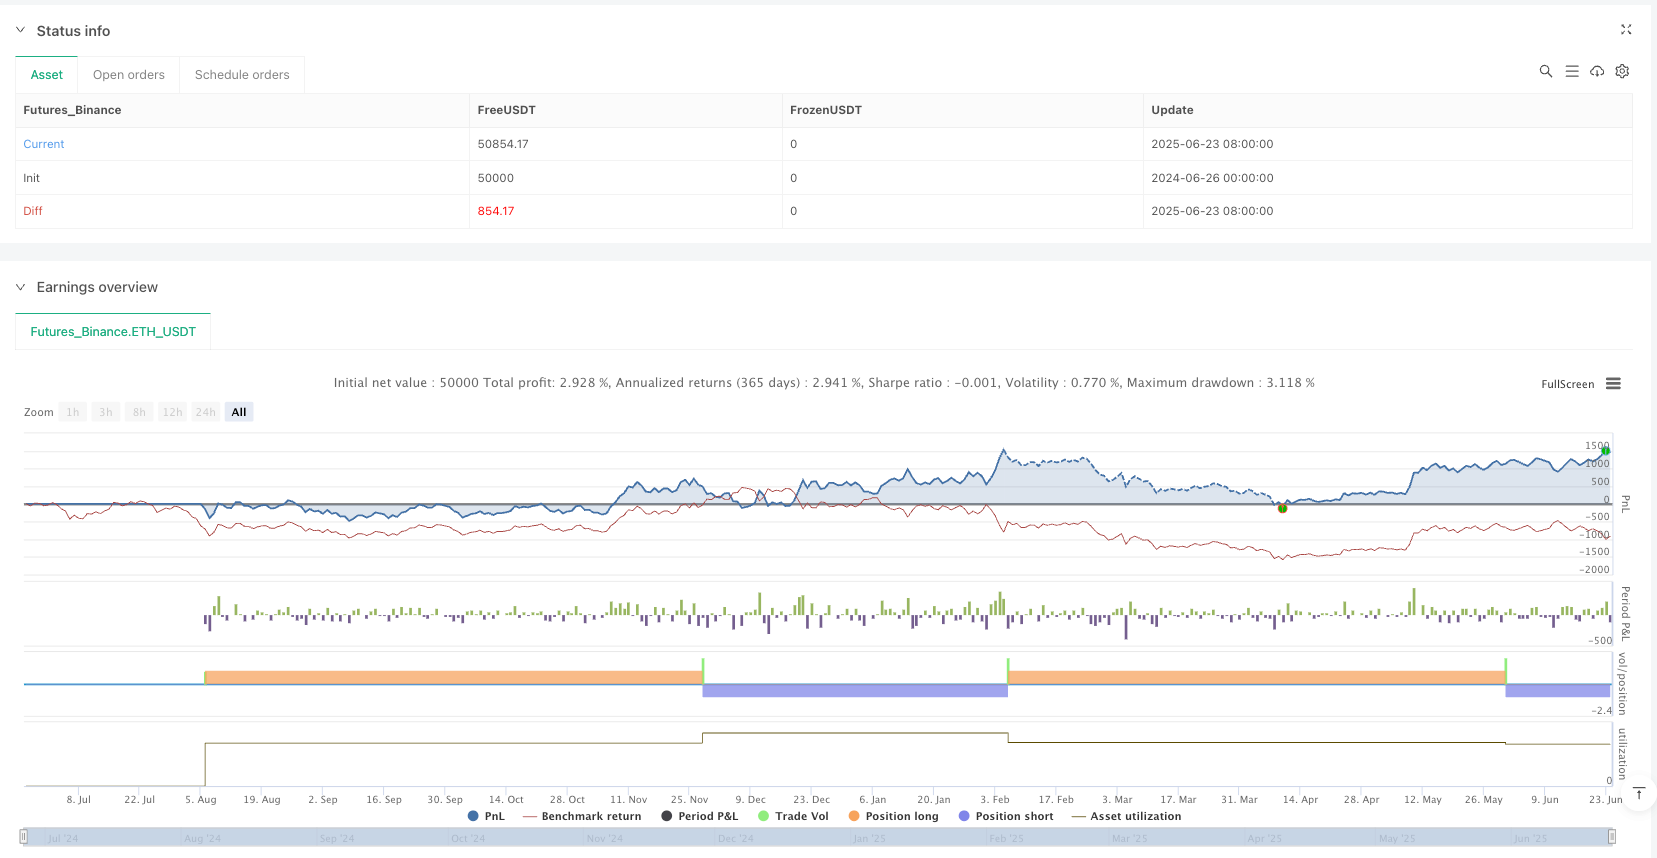

概述
RSI与随机RSI背离交易策略是一种高级技术分析方法,专为识别市场中的关键反转点而设计。该策略结合了相对强弱指标(RSI)和随机相对强弱指标(SRSI)的威力,通过监测价格与这些动量指标之间的背离来预测潜在的趋势变化。此外,策略还整合了指数移动平均线(EMA)作为趋势过滤器,并应用精确的摆动距离过滤器,确保捕捉到有意义的市场结构变化而非市场噪音。
策略原理
该策略的核心原理基于技术分析中的背离概念。背离发生在价格走势与技术指标走势不一致时,通常表明当前趋势可能即将逆转。该策略专注于四种类型的背离:
- 常规看涨背离:当价格创新低,但RSI或SRSI未能创新低时。这表明下跌动能正在减弱,可能预示着上涨趋势的开始。
- 常规看跌背离:当价格创新高,但RSI或SRSI未能创新高时。这表明上涨动能正在减弱,可能预示着下跌趋势的开始。
- 隐藏看涨背离:当价格高于前低,但RSI或SRSI低于前低时。这通常表明上升趋势中的回调,预示着主要上升趋势将继续。
- 隐藏看跌背离:当价格低于前高,但RSI或SRSI高于前高时。这通常表明下降趋势中的反弹,预示着主要下降趋势将继续。
该策略使用了严格的过滤条件来确保背离信号的质量: - 使用回溯期间(默认40个周期)来寻找显著的摆动点 - 要求最小摆动距离百分比(默认1.5%)来过滤微小波动 - 要求与最后摆动点的最小价格变动百分比(默认0.5%)
当检测到背离时,策略会在图表上绘制标签和连接线,使交易者能够直观地识别这些关键信号。并且,策略根据背离信号自动生成做多和做空的入场信号。
策略优势
- 多层面确认:结合RSI和随机RSI提供了双重确认,降低了假信号的可能性。当两个指标都显示背离时,信号更加可靠。
- 全面的背离检测:该策略不仅检测常规背离(预示趋势反转),还检测隐藏背离(预示趋势继续),为交易者提供全方位的市场视角。
- 视觉化表现:通过在图表上直观标记背离,包括标签和连接线,使交易者能够更容易地识别和理解信号。
- 适应性强:策略参数如回溯期间、最小摆动距离和最小价格变动都是可调整的,使交易者能够根据不同市场条件和时间框架优化策略。
- 过滤器减少噪音:通过实施最小摆动距离和价格变动阈值,该策略有效过滤市场噪音,专注于有意义的价格结构变化。
- 趋势上下文:纳入200期EMA提供了更广泛的趋势上下文,帮助交易者理解背离信号在整体市场趋势中的位置。
策略风险
- 假背离:即使有过滤器,市场仍可能产生假背离信号,特别是在高波动或盘整市场中。这可能导致错误的交易决策和潜在亏损。
- 时间滞后:背离信号通常在价格已经开始反转后才形成,这可能导致入场点不理想,特别是在快速变动的市场中。
- 参数敏感性:策略性能高度依赖于参数设置,如回溯期间和最小摆动距离。不适当的参数可能导致过多或过少的信号。
- 指标限制:RSI和SRSI作为动量指标,在某些市场条件下可能不够可靠,尤其是在长期趋势市场或极端波动环境中。
- 缺乏止损机制:当前策略实现没有包含明确的止损策略,这增加了潜在的下行风险。
为减轻这些风险,建议: - 将背离信号与其他技术指标或分析方法结合使用,如支撑/阻力水平、烛台形态或成交量分析 - 在不同市场条件下测试和优化参数设置 - 实施适当的资金管理和止损策略 - 考虑背离信号在整体市场趋势背景下的意义
策略优化方向
- 整合止损和止盈机制:当前策略缺乏风险管理功能。添加基于ATR(平均真实范围)的动态止损,或基于关键支撑/阻力位的固定止损,可以显著提高策略的风险回报比。同样,实施基于价格目标或时间的止盈规则可以锁定利润。
- 增加趋势过滤器:虽然策略已包含EMA作为参考,但没有使用它来过滤交易。可以添加条件,例如只在价格高于200日EMA时考虑看涨背离,或只在价格低于200日EMA时考虑看跌背离,这有助于与主要趋势保持一致。
- 信号确认机制:引入额外的确认指标,如成交量增加、烛台确认形态或其他动量指标的交叉,可以提高信号可靠性。
- 动态参数调整:实现基于市场波动性自动调整回溯期间和摆动距离阈值的机制。例如,在高波动市场中使用更大的阈值,在低波动市场中使用更小的阈值。
- 背离强度评分:开发一个评分系统来评估背离的”强度”,基于价格和指标之间的偏差大小、形成背离的时间长度以及其他相关因素。这可以帮助交易者优先考虑更强的信号。
- 多时间框架分析:整合多时间框架确认,例如,仅当更高时间框架也显示相同方向的背离时才考虑信号,这可以减少假信号。
- 改进价格摆动检测:当前策略使用简单的高点/低点检测。实现更复杂的价格结构分析(如考虑多个摆动点的序列)可以提高背离检测的准确性。
- 市场环境适应:添加市场环境分类功能(如趋势、范围或高波动性),并根据检测到的环境调整策略行为。
总结
RSI与随机RSI背离交易策略是一种复杂而强大的技术分析工具,能够通过识别价格与动量指标之间的不一致来捕捉潜在的市场反转和趋势延续信号。该策略通过整合常规和隐藏背离检测,并应用精心设计的过滤器,提供了一种全面的方法来识别高概率交易机会。
然而,与所有技术分析方法一样,这种策略也存在局限性和风险。通过实施建议的优化,如添加风险管理机制、改进信号确认和整合动态参数调整,可以显著提高策略的稳健性和性能。
最终,该策略最适合作为更广泛交易系统的一部分,结合其他分析工具和适当的资金管理原则。对于理解技术分析和市场结构的交易者来说,这种背离策略可以成为发现高质量交易设置的宝贵工具。
/*backtest
start: 2024-06-26 00:00:00
end: 2025-06-24 08:00:00
period: 2d
basePeriod: 2d
exchanges: [{"eid":"Futures_Binance","currency":"ETH_USDT"}]
*/

//@version=6
strategy("RSI Divergence Strategy", overlay=true)
//strategy("RSI & SRSI Divergence Strategy with EMA & Min Swing Filter + Price Chart Lines", overlay=true)
rsiLength = input.int(14, title="RSI Length")
srsiLength = input.int(14, title="Stochastic RSI Length")
kLength = input.int(3, title="%K Length")
dLength = input.int(3, title="%D Length")
emaLength = input.int(200, title="EMA Length")
lookback = input.int(40, title="Lookback Period for Divergence")
minSwingDistPercent = input.float(1.5, title="Minimum Swing Distance (%)")
minPriceMovePercent = input.float(0.5, title="Minimum Price Move from Last Swing (%)")

rsi = ta.rsi(close, rsiLength)
srsi = ta.stoch(rsi, rsi, rsi, srsiLength)
k = ta.sma(srsi, kLength)
d = ta.sma(k, dLength)
ema200 = ta.ema(close, emaLength)

// === Bullish Regular Divergence ===
var float lastLowPrice = na
var float lastLowRsi = na
var float lastLowSrsi = na
var int lastLowIndex = na
bullishDiv = false
if ta.lowestbars(low, lookback) == 0
    if not na(lastLowPrice) and not na(lastLowRsi) and not na(lastLowSrsi)
        swingDistLow = math.abs(low - lastLowPrice) / lastLowPrice * 100
        priceMoveLow = math.abs(low - lastLowPrice) / lastLowPrice * 100
        if swingDistLow >= minSwingDistPercent and priceMoveLow >= minPriceMovePercent
            if (low < lastLowPrice and rsi > lastLowRsi) or (low < lastLowPrice and k > lastLowSrsi)
                bullishDiv := true

            lastLowPrice := low
            lastLowRsi := rsi
            lastLowSrsi := k
            lastLowIndex := bar_index
    else
        lastLowPrice := low
        lastLowRsi := rsi
        lastLowSrsi := k
        lastLowIndex := bar_index

// === Bearish Regular Divergence ===
var float lastHighPrice = na
var float lastHighRsi = na
var float lastHighSrsi = na
var int lastHighIndex = na
bearishDiv = false
if ta.highestbars(high, lookback) == 0
    if not na(lastHighPrice) and not na(lastHighRsi) and not na(lastHighSrsi)
        swingDistHigh = math.abs(high - lastHighPrice) / lastHighPrice * 100
        priceMoveHigh = math.abs(high - lastHighPrice) / lastHighPrice * 100
        if swingDistHigh >= minSwingDistPercent and priceMoveHigh >= minPriceMovePercent
            if (high > lastHighPrice and rsi < lastHighRsi) or (high > lastHighPrice and k < lastHighSrsi)
                bearishDiv := true

            lastHighPrice := high
            lastHighRsi := rsi
            lastHighSrsi := k
            lastHighIndex := bar_index
    else
        lastHighPrice := high
        lastHighRsi := rsi
        lastHighSrsi := k
        lastHighIndex := bar_index

// === Bullish Hidden Divergence ===
bullishHiddenDiv = false
if ta.lowestbars(low, lookback) == 0
    if not na(lastLowPrice) and not na(lastLowRsi) and not na(lastLowSrsi)
        swingDistLowHidden = math.abs(low - lastLowPrice) / lastLowPrice * 100
        priceMoveLowHidden = math.abs(low - lastLowPrice) / lastLowPrice * 100
        if swingDistLowHidden >= minSwingDistPercent and priceMoveLowHidden >= minPriceMovePercent
            if (low > lastLowPrice and rsi < lastLowRsi) or (low > lastLowPrice and k < lastLowSrsi)
                bullishHiddenDiv := true


// === Bearish Hidden Divergence ===
bearishHiddenDiv = false
if ta.highestbars(high, lookback) == 0
    if not na(lastHighPrice) and not na(lastHighRsi) and not na(lastHighSrsi)
        swingDistHighHidden = math.abs(high - lastHighPrice) / lastHighPrice * 100
        priceMoveHighHidden = math.abs(high - lastHighPrice) / lastHighPrice * 100
        if swingDistHighHidden >= minSwingDistPercent and priceMoveHighHidden >= minPriceMovePercent
            if (high < lastHighPrice and rsi > lastHighRsi) or (high < lastHighPrice and k > lastHighSrsi)
                bearishHiddenDiv := true


// === PLOTS ===
plot(ema200, title="EMA 200", color=color.purple, linewidth=2)

// === STRATEGY ENTRIES ===
if bullishDiv or bullishHiddenDiv
    strategy.entry("Long", strategy.long)
if bearishDiv or bearishHiddenDiv
    strategy.entry("Short", strategy.short)