
Overview
The Multi-Indicator Dynamic Swing Strategy is a comprehensive trading system designed specifically for 4-hour charts, which precisely captures swing opportunities in uptrending markets through the synergistic action of five key technical indicators. This strategy combines the advantages of trend following and pullback entry by using EMA to confirm uptrends, RSI to validate momentum, MACD to confirm direction, volume analysis to strengthen breakout credibility, and Fibonacci retracement levels to find optimal entry points, while incorporating an ATR-based dynamic risk management system to protect capital.
Strategy Principles
The Multi-Indicator Dynamic Swing Strategy is based on a confirmation mechanism involving five complementary indicators:
-
EMA Trend Filtering: Uses a 50-period Exponential Moving Average (EMA) as the primary trend filter. The strategy only considers long opportunities when price is above the EMA, ensuring that trades align with the main trend direction.
-
RSI Momentum Confirmation: Requires the Relative Strength Index (RSI) to not only be above 40 but also rising for three consecutive periods, verifying upward price momentum. Additionally, it sets RSI > 70 as an overbought exit condition, effectively mitigating high-level risks.
-
MACD Bullish Crossover: Provides directional confirmation when the MACD line crosses above the signal line. The strategy employs standard 12/26/9 settings but allows users to customize based on different market characteristics.
-
Volume Breakout Verification: Identifies whether volume reaches 1.5 times above the 20-period average to confirm the strength and credibility of price breakouts, avoiding false breakout traps.
-
Fibonacci Retracement Support: Dynamically calculates Fibonacci retracement levels from recent swing highs and lows, providing ideal entry points when price retraces to the 38.2% to 61.8% support zone, enabling low-risk entries in the trend direction.
The risk management system dynamically sets stop-loss (2×ATR below entry price) and profit targets (3×ATR above entry price) based on the 14-period Average True Range (ATR), achieving a reasonable risk-reward ratio of 1:1.5.
Strategy Advantages
-
Multiple Confirmation Mechanism: Significantly enhances the reliability of trading signals through the collaborative confirmation of five different technical dimensions, reducing interference from false signals and forming a robust filtering system.
-
Dynamic Adaptability: All indicator parameters can be adjusted according to different market environments and trading instrument characteristics, giving the strategy high flexibility and adaptability.
-
Precise Entry Timing: By combining trend confirmation with Fibonacci retracement support, the strategy can find entry points in the trend direction with minimal risk and maximum potential return, avoiding the risks of chasing highs.
-
Risk Management System: The ATR-based dynamic stop-loss and profit-taking settings allow risk control to adjust automatically based on market volatility, maintaining consistent risk-reward characteristics in different volatile environments.
-
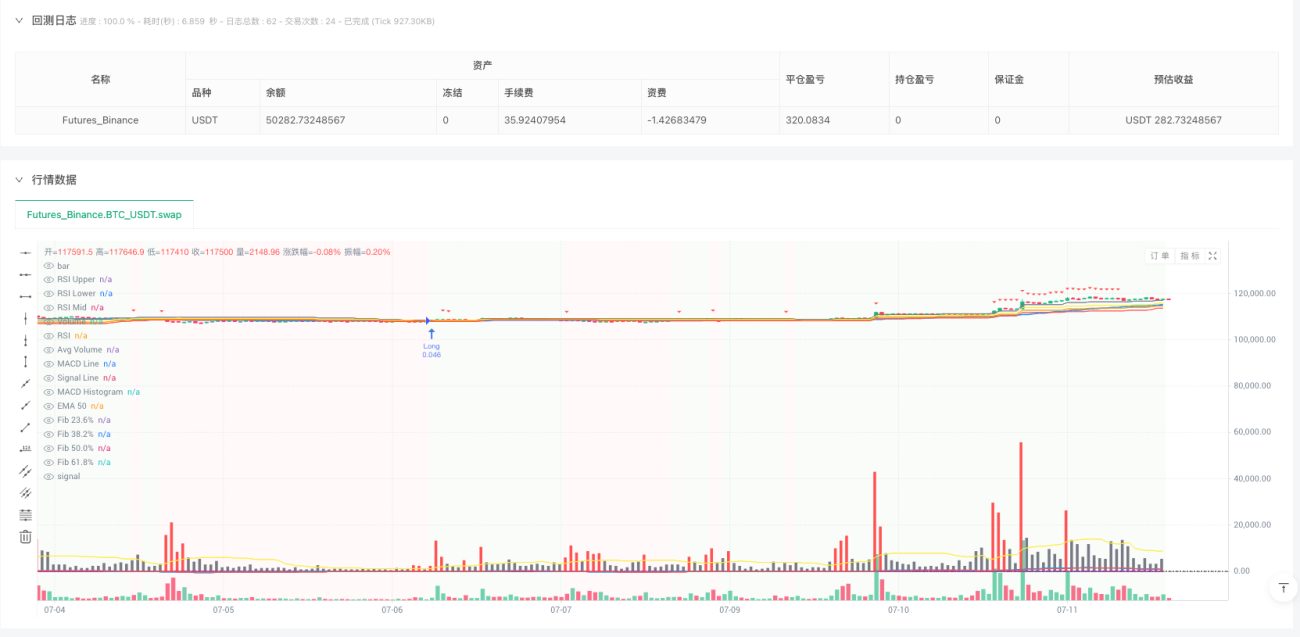
Visualized Decision Support: The strategy provides a clear graphical interface including entry/exit signal markers, condition information tables, and multi-panel indicator displays, greatly enhancing the intuitiveness and convenience of trading decisions.
-
Comprehensive Alert System: Built-in entry and exit signal alerts ensure traders don't miss important trading opportunities, improving the timeliness of strategy execution.
Strategy Risks
-
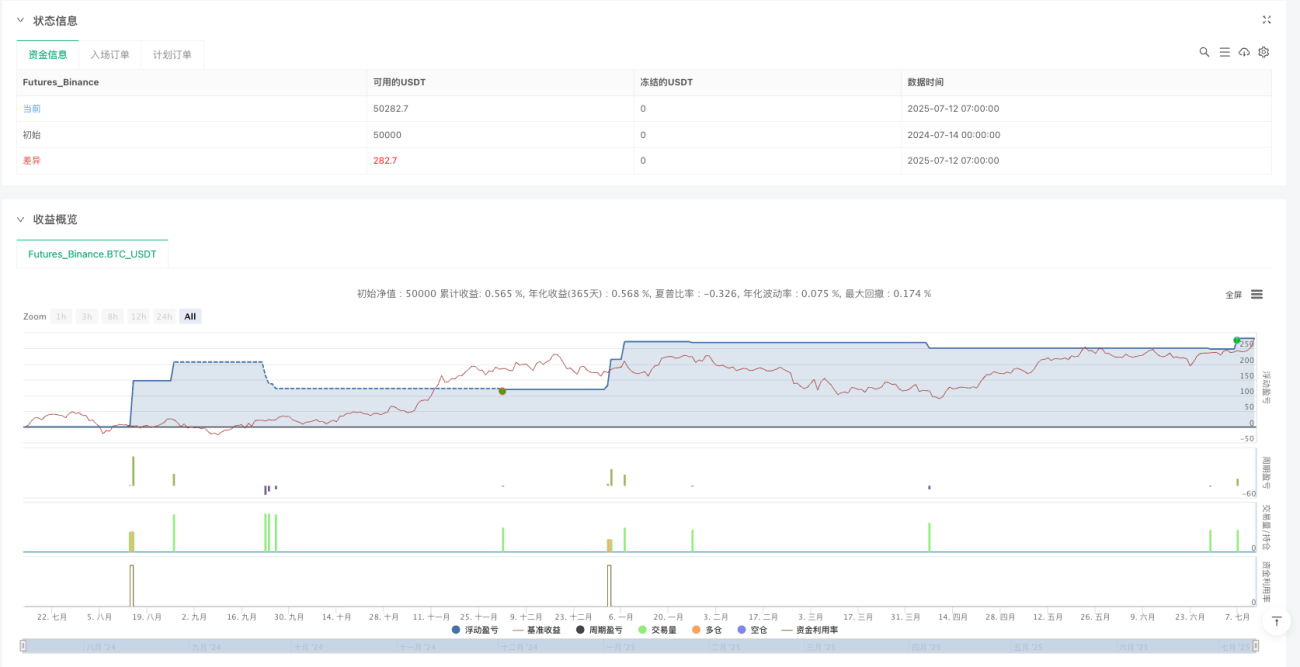
Over-reliance on Historical Backtesting: Although the strategy may perform excellently in backtesting, changing market conditions may cause future performance to differ from historical backtests. It is recommended to conduct thorough forward testing and small capital verification before live trading.
-
Parameter Optimization Risk: Parameter settings that overfit specific historical data may cause the strategy to fail in future markets. Excessive optimization should be avoided, maintaining reasonable and robust parameter settings.
-
Signal Overlap Delay: The condition of all five indicators being satisfied simultaneously may be relatively lagging, potentially missing some profitable opportunities. Consider introducing early warning mechanisms, such as MACD histogram changes or RSI directional changes as advance alerts.
-
Trend Reversal Risk: The strategy is primarily suitable for markets with clear trends and may produce frequent false signals in ranging or highly volatile markets. Consider adding volatility filters or market state classification modules to mitigate this risk.
-
Fixed Multiplier Risk: Although ATR is used to dynamically set stop-loss and profit targets, fixed ATR multipliers (2 and 3) may not be suitable for all market environments. Consider dynamically adjusting ATR multipliers in markets with extreme volatility changes.
Strategy Optimization Directions
-
Adaptive Multiplier Adjustment: ATR multipliers can be dynamically adjusted according to market volatility states, such as using larger multipliers in low-volatility markets and smaller multipliers in high-volatility markets, to optimize risk-reward characteristics. Implementation can be achieved by calculating the standard deviation of historical ATR to determine the current volatility state.
-
Time Filter Integration: Introduce trading time filters to avoid specific high-volatility or low-efficiency periods, such as during important economic data releases. This can be implemented by checking bar_index and trading time conditions.
-
Market State Classification: Develop a market state classification module to distinguish between trending and oscillating markets, applying different strategy parameters or trading logic in different market states. This can be implemented through the ADX indicator or the relationship between price and multi-period moving averages.
-
Dynamic Position Management: Implement a dynamic position management system based on market conditions and signal strength, increasing position size when high-confidence signals appear and reducing position size with weaker signals. This can be achieved by evaluating the strength of conditions satisfied by each indicator.
-
Partial Profit-Taking Mechanism: Introduce a staged profit-taking mechanism to partially close positions when specific profit targets are reached, both securing partial profits and retaining upside potential. This can be implemented through the qty_percent parameter in the strategy.exit function.
Conclusion
The Multi-Indicator Dynamic Swing Strategy is a comprehensive and robust trading system that provides high-quality long signals through the collaborative work of five dimensions: EMA trend filtering, RSI momentum confirmation, MACD directional verification, volume breakout confirmation, and Fibonacci retracement support. The strategy not only features a reliable signal generation mechanism but is also equipped with an ATR-based dynamic risk management system, suitable for medium to long-term swing traders.
By introducing adaptive multiplier adjustments, time filters, market state classification, dynamic position management, and partial profit-taking mechanisms, the strategy has the potential to further enhance its stability and profitability in various market environments. For investors seeking systematic, clearly defined, and risk-controlled trading methods, the Multi-Indicator Dynamic Swing Strategy provides a worthy consideration.
/*backtest
start: 2024-07-14 00:00:00
end: 2025-07-12 08:00:00
period: 1h
basePeriod: 1h
exchanges: [{"eid":"Futures_Binance","currency":"BTC_USDT"}]
*/

// This Pine Script® code is subject to the terms of the Mozilla Public License 2.0 at https://mozilla.org/MPL/2.0/
// © robert-angel
//@version=5
strategy("5-Indicator Swing Strategy", overlay=true, default_qty_type=strategy.percent_of_equity, default_qty_value=10)- 1