

Overview
The Multi-Level Trend Momentum Trading Strategy with ATR Risk Management System is a short-term intraday trading strategy designed specifically for the 15-minute timeframe. This strategy cleverly combines price action signals from candlestick reversal patterns with momentum confirmation from the MACD indicator to identify high-probability trade entry points. The strategy employs ATR-based dynamic stop loss and take profit levels to manage risk and maximize returns, adjusting to current market volatility. Additionally, the strategy labels key price levels on the chart, allowing traders to clearly understand entry points, stop loss levels, and target profit points.
Strategy Principles
The core principle of this strategy is to capture trading opportunities in the early stages of market trend changes through a dual confirmation system that combines price patterns and technical indicators. Specifically, the strategy is based on the following key components:
-
Candlestick Pattern Recognition:
- Bullish signals: including bullish engulfing patterns and hammers
- Bearish signals: including bearish engulfing patterns and shooting stars
-
MACD Momentum Confirmation:
- Bullish signal: MACD line crosses above the signal line
- Bearish signal: MACD line crosses below the signal line
-
Trade Signal Generation:
- Long condition: Bullish candlestick pattern + MACD bullish signal
- Short condition: Bearish candlestick pattern + MACD bearish signal
-
Risk Management:
- Uses the ATR (Average True Range) indicator to dynamically set stop loss and profit levels
- Stop loss distance = 1.5 × ATR
- Profit target = 2.0 × ATR
This multi-layer confirmation mechanism ensures the reliability of trading signals, while the ATR risk management system adjusts risk-reward parameters according to actual market volatility, making the strategy highly adaptable.
Strategy Advantages
After in-depth analysis of the strategy code, the following key advantages can be summarized:
-
Dual Confirmation Mechanism: Combining price action (candlestick patterns) and momentum indicators (MACD) can significantly reduce false signals and improve trade success rates. The strategy only triggers a trade when two independent analytical methods give consistent signals simultaneously.
-
Dynamic Risk Management: ATR-based stop loss and profit levels automatically adjust according to market volatility, avoiding the inflexibility issues associated with fixed points. During periods of high volatility, stops are wider; during periods of low volatility, stops are tighter.
-
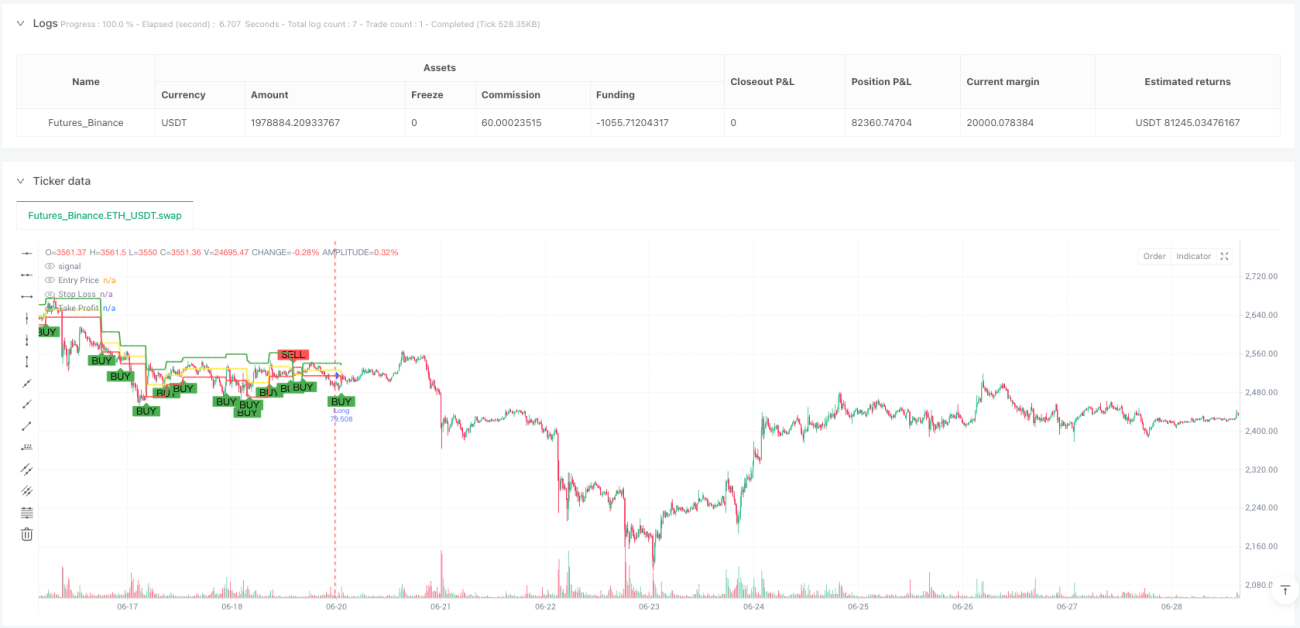
Clear Visual Feedback: The strategy plots trading signals and key price levels (entry price, stop loss level, profit target) on the chart, allowing traders to intuitively understand trading logic and risk management.
-
Flexible Parameter Settings: The strategy allows users to adjust MACD parameters, ATR calculation periods, and stop loss/profit multipliers, which can be optimized according to personal risk preferences and specific market environments.
-
Integrated Money Management: By using a percentage of equity to determine position size, the strategy incorporates basic money management functionality, helping to control risk exposure for each trade.
Strategy Risks
Despite the strategy's sound design, there are still some potential risks and limitations:
-
False Signals in Ranging Markets: In consolidating markets without clear trends, MACD may produce frequent crossover signals which, combined with candlestick patterns, could lead to overtrading and consecutive losses.
- Solution: Consider adding additional filtering conditions, such as trend indicators or volatility thresholds, to avoid trading in ranging markets.
-
Slippage Risk During Extreme Market Events: During major news or black swan events, markets may gap quickly, causing actual stop loss execution prices to be far below preset levels.
- Solution: Consider using maximum stop loss amount limits and reduce positions or pause trading before expected high-volatility events (such as important economic data releases).
-
Parameter Optimization Adaptability Issues: Over-optimizing MACD parameters and ATR multipliers may cause the strategy to perform well on historical data but poorly in future market environments.
- Solution: Conduct robustness testing, verifying strategy performance across different market conditions and time periods to avoid overfitting.
-
Lack of Handling Mechanism for Consecutive Signals: When multiple trading signals appear consecutively, the strategy has no clear processing logic, potentially leading to overtrading or missing better entry points.
- Solution: Implement signal filtering logic, such as setting minimum interval times or limiting the number of trades within a specific time period.
Optimization Directions
Based on the above analysis, the strategy can be optimized in the following areas:
-
Add Trend Filters: Introduce trend identification components (such as moving average direction or ADX indicator) to only trade in confirmed trend directions, avoiding too many signals in oscillating markets. This can improve the strategy's precision and reduce losing trades caused by false signals.
-
Optimize Entry Timing: The current strategy enters at the open of the next candle after a signal appears, potentially missing optimal price levels. Consider using limit orders to enter at specific price zones or designing more refined entry mechanisms.
-
Implement Partial Profit Taking: When prices reach certain profit levels (such as 1×ATR), consider closing positions in batches, with some portion continuing to be held for higher target prices. This allows for securing basic profits while letting winners run.
-
Add Time Filters: Some markets have better volatility and liquidity during specific trading sessions. Time filtering conditions can be added to only look for trading signals during the most active market sessions (such as when European and American markets overlap).
-
Integrate Market Sentiment Indicators: Introduce volatility indicators (such as VIX or ATR change rates) to evaluate the current market environment, automatically adjusting stop loss levels or trading frequency during periods of extreme volatility.
-
Optimize Money Management: Implement more sophisticated money management algorithms, such as the Kelly criterion or fixed risk ratio methods, to dynamically adjust position sizes based on the strategy's historical win rate and profit/loss ratio.
Summary
The Multi-Level Trend Momentum Trading Strategy with ATR Risk Management System is a well-designed short-term trading system that provides a reliable method for generating trading signals by combining candlestick pattern analysis and MACD momentum confirmation. Its ATR-based dynamic risk management system enables the strategy to adapt to different market volatility conditions, while clear visual feedback and labeling functions help traders better understand and execute trading plans.
Despite some potential risks, such as false signals in ranging markets and slippage in extreme market conditions, these issues can be effectively mitigated through the suggested optimization measures, including adding trend filters, optimizing entry mechanisms, implementing partial profit strategies, and integrating market sentiment indicators. Furthermore, further refinement of the money management system will help control overall risk and optimize long-term returns.
Overall, this strategy provides intraday short-term traders with a structured trading framework that combines key elements of technical analysis, risk management, and execution visualization. By reasonably setting parameters and implementing the suggested optimization measures, traders can further enhance the strategy's robustness and profitability.
/*backtest
start: 2025-06-20 00:00:00
end: 2025-07-20 00:00:00
period: 15m
basePeriod: 15m
exchanges: [{"eid":"Futures_Binance","currency":"ETH_USDT","balance":2000000}]
*/

//@version=5
strategy("Gold 15m Candle + MACD Strategy with SL/TP & Price Levels", overlay=true, default_qty_type=strategy.percent_of_equity, default_qty_value=10)

// === MACD Settings ===- 1