
概述
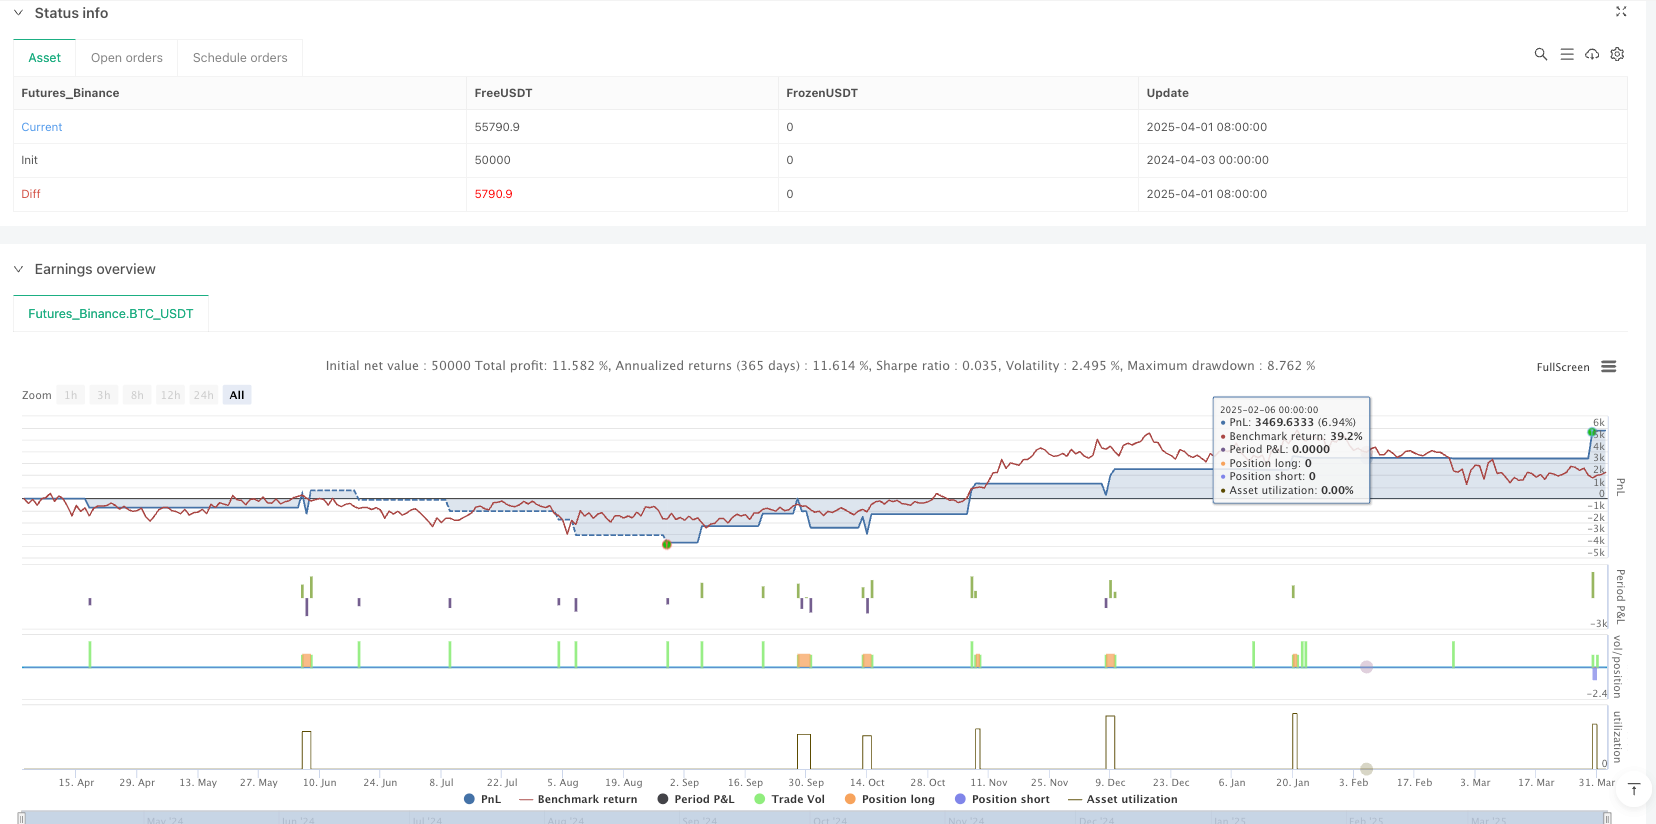
多重过滤收敛短线交易策略是一种精密设计的量化交易方法,专为希望在快速变动的市场中捕捉短期价格波动的交易者而设计。该策略通过结合趋势分析、动量指标、成交量、波动性和蜡烛图形态,来识别精确的买入和卖出机会。这种方法解决了在波动或不可预测市场中寻找可靠入场和出场点的问题,使其成为短线交易者的理想选择,同时通过止损和止盈设置提供内置的风险管理功能。
策略原理
该策略采用多重过滤机制,只有当所有技术指标同时满足条件时才生成交易信号,以确保高概率的交易机会。具体来说,策略使用以下五个关键组件:
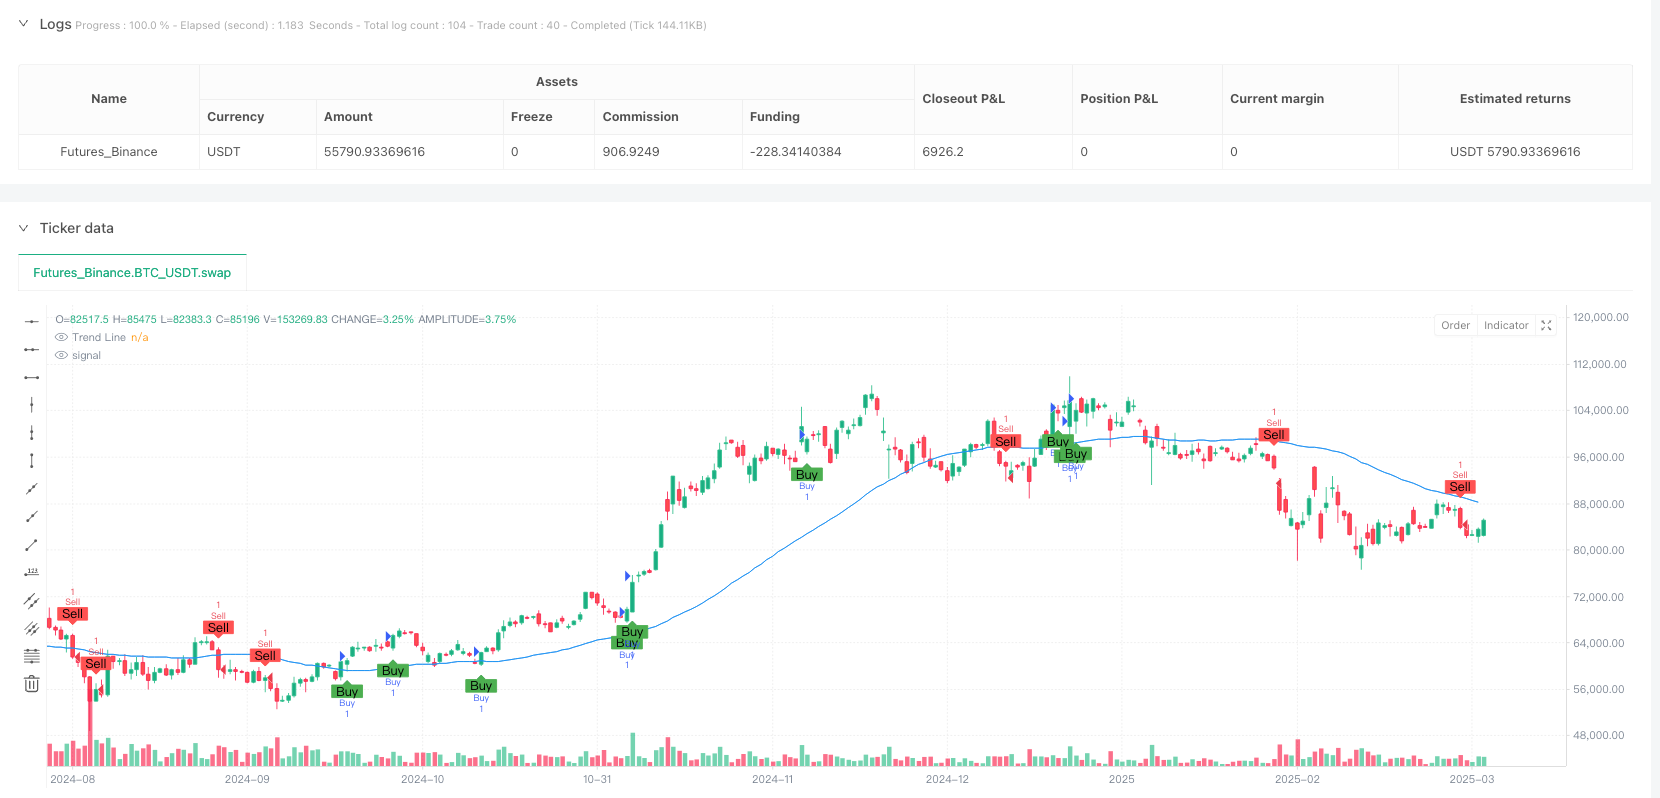
趋势方向:50周期简单移动平均线(SMA)作为趋势过滤器。如果价格在这条线之上,表示看涨市场,适合买入;如果在线之下,表示看跌市场,适合卖出。
动量指标:14周期相对强弱指数(RSI)用于测量价格变动的速度。它确保市场在买入时不会超买(RSI < 70),在卖出时不会超卖(RSI > 30)。
成交量分析:策略比较当前交易量与20周期平均成交量,以确认市场参与度强劲,只有高于平均成交量的走势才会触发信号。
波动性:14周期平均真实范围(ATR)检查价格波动是否足够大(高于用户设定的最小值,默认为2.0)以证明交易的合理性。
蜡烛图形态:简单而有效的形态识别(例如,在开盘低于前一天收盘价后收盘高于前一天收盘价的看涨蜡烛)为信号添加确认。
买入或卖出信号只有在所有这些条件一致时才会触发,确保高概率交易。一旦信号触发,策略会自动下单,并设置可自定义的止损(例如,入场点下方1%)和止盈(例如,入场点上方2%)水平。
策略优势
多重过滤收敛短线交易策略具有多项明显优势:
减少虚假信号:由于策略要求所有五个技术指标同时确认,大大降低了虚假信号的可能性,提高了交易成功率。
全面的市场分析:通过同时考虑趋势、动量、成交量、波动性和价格形态,策略提供了对市场状况的全面分析,而不仅仅依赖单一指标。
适应性强:策略的参数可根据不同的市场环境进行调整,使其适用于各种交易品种和时间框架,无论是低波动性还是高波动性市场。
内置风险管理:自动止损和止盈设置确保每笔交易的风险得到控制,帮助交易者保持纪律,避免情绪化决策。
技术确认的层次性:策略提供了多层次的技术确认,从长期趋势(SMA)到短期价格行为(蜡烛图形态),使交易者能够更加确信信号的可靠性。
自动化潜力:策略的明确规则和条件使其易于编程和自动化,减少了人为干预的需要,适合忙碌的交易者或希望减少情绪影响的交易者。
策略风险
尽管多重过滤收敛策略设计精良,但仍存在一些潜在风险和局限性:
错过交易机会:由于策略要求所有过滤器同时确认,可能会错过一些只满足部分条件但仍然有利可图的交易机会,特别是在快速变动的市场中。
参数优化需求:策略的有效性高度依赖于为特定交易品种和市场条件选择合适的参数。不恰当的参数设置可能导致过度优化或表现不佳。
固定止损百分比的局限性:使用固定百分比的止损可能不适合所有市场环境,特别是在波动性突然变化的时期。
成交量依赖:在流动性较低的市场或某些时间段,高成交量要求可能导致信号频率降低,减少交易机会。
技术指标滞后性:所有技术指标都存在一定程度的滞后性,这可能导致在极端市场条件下反应较慢。
强趋势市场的形态限制:在强劲趋势市场中,可能难以满足特定的蜡烛图形态要求,导致错过潜在的趋势跟随机会。
为缓解这些风险,交易者应考虑在实盘交易前进行充分的回测,并根据自己的风险承受能力调整参数。
策略优化方向
基于对策略原理和潜在风险的分析,以下是几个可能的优化方向:
自适应参数:将固定参数(如移动平均线长度、RSI阈值)改为基于市场条件自动调整的动态参数。例如,在不同的波动性环境中,ATR最小值可以根据历史波动性自动调整。
多时间框架分析:整合多个时间框架的确认信号,例如使用较大时间框架来确定主要趋势方向,然后在较小时间框架上寻找具体入场点。
改进止损策略:用基于ATR的止损代替固定百分比止损,以更好地适应不同交易品种的波动特性。例如,止损可以设置为入场点减去1.5倍当前ATR值。
加入市场状态过滤器:在算法中加入市场状态(如区间震荡或趋势)的识别功能,并根据不同市场状态采用不同的交易规则。
信号强度分级:不是简单的二元信号(买入/卖出),而是基于满足条件的强度为信号分级,允许根据信号强度调整仓位大小。
机器学习整合:使用机器学习算法优化参数组合或预测哪些信号更可能成功,特别是在识别特定市场环境中的模式方面。
这些优化可以单独实施,也可以组合使用,以提高策略的整体性能和适应性。实施任何优化前,建议在不同市场条件下进行彻底的回测。
总结
多重过滤收敛短线交易策略通过整合多种技术分析方法,为短线交易者提供了一个全面而强大的交易系统。它的核心优势在于将多个独立的技术指标结合起来,只有当所有指标一致指向同一方向时才生成交易信号,从而显著提高了信号的可靠性。
该策略的灵活性使其适用于各种市场环境和交易品种,而内置的风险管理功能则有助于保护资本并维持长期盈利能力。尽管存在一些固有的局限性和风险,但通过持续的参数优化和上述建议的策略改进,这些问题可以得到有效缓解。
对于希望在短线交易中应用系统化和纪律性方法的交易者来说,多重过滤收敛策略提供了一个坚实的框架,既考虑了市场的技术面,又注重风险控制,是量化交易领域中一种全面而平衡的方法。
/*backtest
start: 2024-04-03 00:00:00
end: 2025-04-02 00:00:00
period: 1d
basePeriod: 1d
exchanges: [{"eid":"Futures_Binance","currency":"BTC_USDT"}]
*/

//@version=6
strategy("Malama's Scalping", overlay=true)

// ──────────────────────────────
// SETTINGS YOU CAN CHANGE
// ──────────────────────────────
// Trend Length: How many candles (price bars) to check for the trend
trendLength = input.int(50, title="Trend Length")

// RSI Length: How many candles to measure price speed
rsiLength = input.int(14, title="RSI Length")

// Stop Loss: How much you’re willing to lose (in %)
stopLossPerc = input.float(1.0, title="Stop Loss (%)")

// Take Profit: How much profit you want to take (in %)
takeProfitPerc = input.float(2.0, title="Take Profit (%)")

// Volume Length: How many candles to average volume over
volumeLength = input.int(20, title="Volume Length")

// Volatility (ATR) Length: How many candles to measure price movement
atrLength = input.int(14, title="Volatility Length")

// Minimum Volatility: Price needs to move this much to trade (adjust for TSLA)
minVolatility = input.float(2.0, title="Minimum Volatility (ATR)")

// ──────────────────────────────
// CALCULATIONS
// ──────────────────────────────
// Trend: The average price over the trend length (a blue line on the chart)
trendMA = ta.sma(close, trendLength)

// Is the price above the trend line? (Good for buying)
isBullish = close > trendMA

// Is the price below the trend line? (Good for selling)
isBearish = close < trendMA

// RSI: Checks how fast the price is moving (0-100 scale)
rsiValue = ta.rsi(close, rsiLength)

// Is RSI not too high for buying? (Below 70 means it’s okay)
isRSIOKForBuy = rsiValue < 70

// Is RSI not too low for selling? (Above 30 means it’s okay)
isRSIOKForSell = rsiValue > 30

// Volume: Is today’s trading activity higher than the average?
volumeAvg = ta.sma(volume, volumeLength)
isHighVolume = volume > volumeAvg

// Volatility (ATR): Measures how much the price is moving on average
atrValue = ta.atr(atrLength)

// Is the market moving enough to trade? (ATR must be above the minimum)
isVolatileEnough = atrValue > minVolatility

// Candlestick Pattern: A simple check for a strong buy signal
// (Price opens lower than yesterday’s close but closes higher)
bullishPattern = open < close[1] and close > open[1]

// Candlestick Pattern: A simple check for a strong sell signal
// (Price opens higher than yesterday’s close but closes lower)
bearishPattern = open > close[1] and close < open[1]

// ──────────────────────────────
// SIGNALS
// ──────────────────────────────
// Buy Signal: Price is above trend, RSI is okay, volume is high, pattern fits, and market is moving enough
buySignal = isBullish and isRSIOKForBuy and isHighVolume and bullishPattern and isVolatileEnough

// Sell Signal: Price is below trend, RSI is okay, volume is high, pattern fits, and market is moving enough
sellSignal = isBearish and isRSIOKForSell and isHighVolume and bearishPattern and isVolatileEnough

// ──────────────────────────────
// VISUALS ON THE CHART
// ──────────────────────────────
// Show the trend line in blue
plot(trendMA, color=color.blue, title="Trend Line")

// Show a green "Buy" label below the bar when it’s time to buy
plotshape(buySignal, location=location.belowbar, color=color.green, style=shape.labelup, title="Buy", text="Buy")

// Show a red "Sell" label above the bar when it’s time to sell
plotshape(sellSignal, location=location.abovebar, color=color.red, style=shape.labeldown, title="Sell", text="Sell")

// ──────────────────────────────
// AUTOMATIC TRADING
// ──────────────────────────────
// If there’s a buy signal, enter a buy trade and set stop loss/take profit
if (buySignal)
    strategy.entry("Buy", strategy.long)
    strategy.exit("Exit Buy", "Buy", stop=close * (1 - stopLossPerc / 100), limit=close * (1 + takeProfitPerc / 100))

// If there’s a sell signal, enter a sell trade and set stop loss/take profit
if (sellSignal)
    strategy.entry("Sell", strategy.short)
    strategy.exit("Exit Sell", "Sell", stop=close * (1 + stopLossPerc / 100), limit=close * (1 - takeProfitPerc / 100))