多周期超趋势EMA动量过滤策略

ATR EMA DEMA RSI supertrend VOLUME SL TP
创建日期: 2025-08-15 11:33:46 最后修改: 2025-08-15 11:33:46
复制: 0 点击次数: 286
avatar of ianzeng123 ianzeng123
2
关注
319
关注者

多周期超趋势EMA动量过滤策略 多周期超趋势EMA动量过滤策略

概述

该策略是一种高级趋势跟踪系统,结合了超趋势指标(Supertrend)与多重动量过滤器,专为捕捉强劲趋势而设计。其核心是利用ATR(平均真实范围)动态调整的超趋势指标,配合EMA(指数移动平均线)和DEMA(双重指数移动平均线)作为趋势确认工具,同时整合RSI(相对强弱指标)和交易量过滤器增强入场信号可信度。该策略内置了基于ATR的止损、止盈和追踪止损机制,并提供多个时间周期的预设参数,适应不同交易风格。特别值得注意的是,该策略具有智能再入场逻辑,能够在上升趋势中抓住回调机会,从而捕捉连续性上涨行情。

策略原理

该策略的核心原理基于多层信号确认机制,构建了一个全面的交易决策框架:

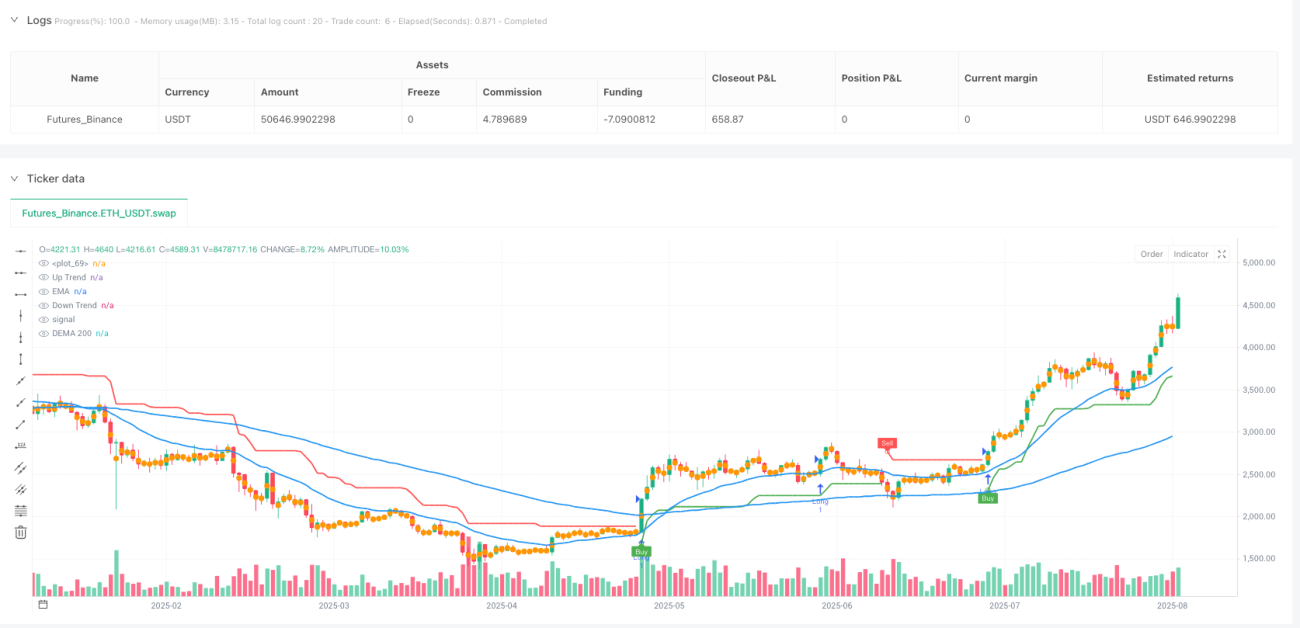
  1. 超趋势核心信号系统:利用ATR计算动态趋势带,当收盘价突破下轨时产生买入信号(上翻),突破上轨时产生卖出信号(下翻)。ATR周期和乘数可调整以适应不同市场环境的波动性。

  2. 动量确认过滤:要求价格位于短期EMA(默认21周期)和长期DEMA(默认200周期)之上,确保交易方向与主要趋势一致,避免逆势交易。

  3. 信号强度验证:通过RSI(默认要求>50)确认价格动量,以及交易量大于其EMA(默认20周期)确认市场参与度,提高入场信号质量。

  4. 智能再入场机制:在已确认的上升趋势中,当价格回调后重新站上EMA且满足其他条件时,策略将再次入场,有效捕捉趋势延续中的机会。

  5. 风险管理系统

    • 止损设置在入场价下方1个ATR(默认)
    • 止盈设置在入场价上方3个ATR(可选)
    • 一旦获利超过1个ATR,启动追踪止损机制,锁定部分利润
  6. 多周期参数预设

    • “Auto-1H/4H”:ATR周期10,乘数3,适合短期摇摆交易
    • “Auto-1D”:ATR周期14,乘数3,适合日线趋势跟踪
    • “Auto-1W”:ATR周期20,乘数4,适合长期趋势捕捉

策略优势

该策略经过深入分析,具有以下显著优势:

  1. 自适应性强:超趋势指标基于ATR动态调整,能够自动适应市场波动性变化,在不同市场环境中保持有效性。

  2. 多层确认减少假信号:通过EMA、DEMA、RSI和交易量的多重验证,显著降低了虚假信号风险,提高交易质量。

  3. 智能再入场捕捉延续性行情:创新的再入场逻辑允许在上升趋势中的回调后重新入场,有效利用了趋势中的波动,提高资金利用效率。

  4. 完整的风险管理体系:内置ATR基础的止损、止盈和追踪止损机制,既限制了单笔交易亏损,又能有效保护已获利润,降低回撤风险。

  5. 多周期预设简化操作:针对不同时间框架的预设参数,使策略易于在多种交易周期上实施,适应不同交易者的时间偏好。

  6. 视觉辅助直观明确:通过颜色填充区分上升和下降趋势,配合清晰的买卖信号标记,使市场状态一目了然,便于交易决策。

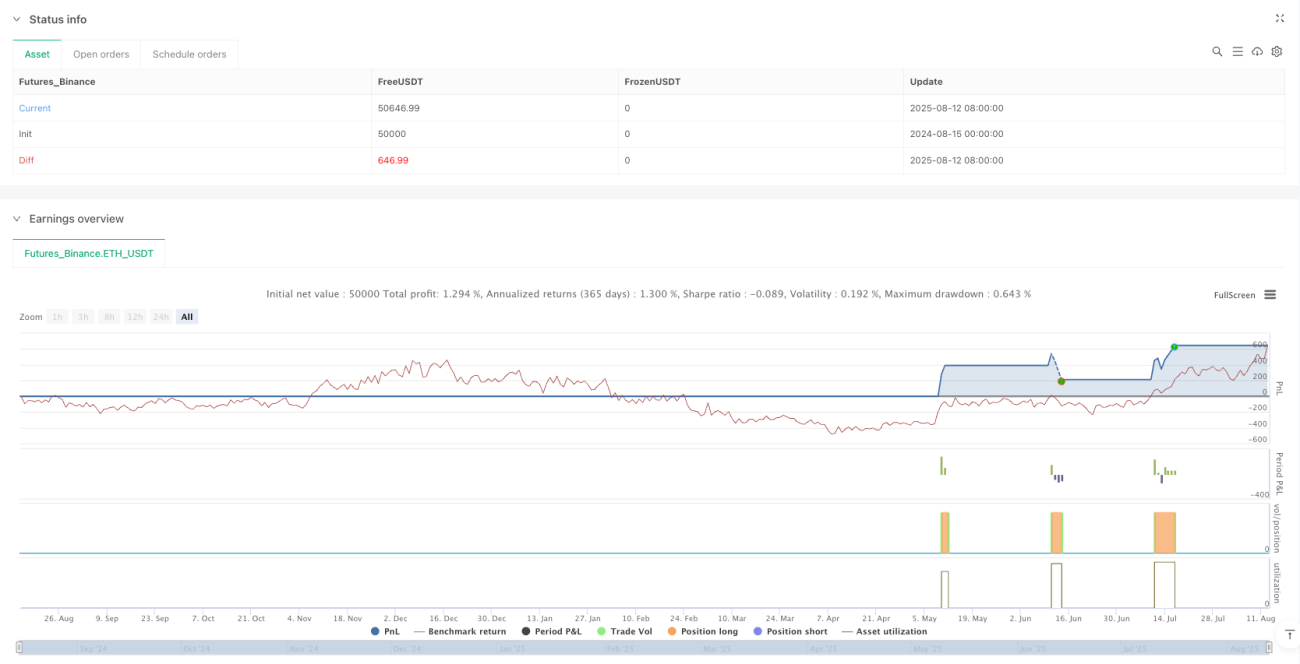
  7. 经过实际回测验证:在日线周期上显示约60%的胜率和大于4的利润因子,特别适合趋势明显的市场环境。

策略风险

尽管该策略设计全面,但仍存在以下潜在风险:

  1. 震荡市场表现欠佳:在无明确趋势的盘整市场中,可能频繁触发止损,导致连续小额亏损累积。解决方法是在市场结构不明确时暂停交易,或增加ATR乘数以降低信号敏感度。

  2. 过滤条件可能错过部分机会:多重过滤条件虽然提高了信号质量,但也可能导致错过某些初期趋势机会。交易者可考虑根据个人风险偏好调整过滤条件严格程度。

  3. 参数敏感性:ATR周期和乘数设置对策略性能影响显著,不同市场环境可能需要不同参数。建议通过回测优化特定市场的参数设置。

  4. 回撤风险:回测显示在使用全仓位时可能出现较大回撤(高达100%+)。必须严格执行资金管理,每笔交易风险控制在1-2%以内。

  5. 历史数据有限性:策略主要在特定市场和时间段内进行回测,可能存在过拟合风险。在实盘应用前应进行更广泛的市场和时间段测试。

  6. 缺乏极端市场条件测试:策略可能未经历市场剧烈波动或流动性危机等极端情况测试,在此类情况下表现未知。

优化方向

通过代码深度分析,该策略可在以下方向进行优化:

  1. 自适应参数调整:开发基于市场波动性动态调整ATR乘数和周期的机制,使策略能够自动适应市场状态变化。例如,在波动性增加时提高ATR乘数,在波动性降低时减小ATR乘数。

  2. 整合市场状态分类:引入市场状态识别模块(如使用布林带宽度、ADX等),根据市场是处于趋势还是震荡状态自动调整策略参数或暂停交易。

  3. 多周期分析框架:增加多周期分析功能,要求更高时间框架趋势与当前时间框架一致才执行交易,提高趋势判断的准确性。

  4. 优化再入场逻辑:细化再入场条件,可考虑增加斐波那契回调水平或关键支撑位确认,提高再入场点的精确性。

  5. 资金管理优化:实现动态仓位管理,基于市场波动性、账户净值和连续盈亏状态自动调整仓位大小,优化资金曲线表现。

  6. 增加市场情绪指标:整合如VIX指数(波动率指数)或交易量变化率等市场情绪指标,在市场恐慌或过度乐观时调整策略行为。

  7. 机器学习优化:利用机器学习算法优化参数选择和入场时机,通过历史数据训练模型预测最佳交易参数组合。

总结

多周期超趋势EMA动量过滤策略是一个设计完善的趋势跟踪系统,通过结合超趋势指标与多重动量过滤器,建立了一套全面的交易决策框架。其核心优势在于自适应性强、多层确认减少假信号、智能再入场捕捉延续性行情以及完整的风险管理体系。该策略特别适合趋势明显的市场环境,在日线周期上展现了良好的回测表现。

然而,该策略在震荡市场中表现可能欠佳,且存在参数敏感性和潜在回撤风险。为进一步提升策略稳健性,可考虑发展自适应参数调整、整合市场状态分类、构建多周期分析框架、优化再入场逻辑、改进资金管理方式、增加市场情绪指标以及应用机器学习技术。

最终,该策略为趋势跟踪交易提供了一个技术指标严谨、风险管理完善的框架,但使用时应始终牢记风险控制的重要性,将每笔交易的风险限制在可接受范围内,并根据个人交易风格和市场环境适当调整策略参数。

策略源码
/*backtest
start: 2024-08-15 00:00:00
end: 2025-08-13 08:00:00
period: 1d
basePeriod: 1d
exchanges: [{"eid":"Futures_Binance","currency":"ETH_USDT"}]
*/

//@version=5
strategy("Supertrend EMA Strategy _V29", overlay=true, format=format.price, precision=2, initial_capital=1000)
// Inputs
tf_preset = input.string("Manual", title="Timeframe Preset", options=["Manual", "Auto-1H/4H", "Auto-1D", "Auto-1W"])
atr_period = input.int(10, title="ATR Period")
src = hl2
atr_multiplier = input.float(3.0, title="ATR Multiplier", step=0.1)
change_atr = input.bool(true, title="Change ATR Calculation Method?")
show_signals = input.bool(true, title="Show Buy/Sell Signals?")
highlighting = input.bool(true, title="Highlighter On/Off?")
ema_length = input.int(21, title="EMA Length")
dema_length = input.int(200, title="DEMA Length")
tp_multiplier = input.float(3.0, title="Take Profit Multiplier (ATR, 0=off)", step=0.5)

allow_long = input.bool(true, title="Allow Long Trades")
allow_short = input.bool(false, title="Allow Short Trades")
sl_multiplier = input.float(1.0, title="Stop Loss Multiplier (ATR, 0=off)", step=0.5)
use_vol_filter = input.bool(true, title="Use Volume Filter?")
vol_ema_length = input.int(20, title="Volume EMA Length", minval=1)
use_rsi_filter = input.bool(true, title="Use RSI Filter?")
rsi_length = input.int(14, title="RSI Length")
rsi_threshold = input.int(50, title="RSI Buy Threshold")
// Auto-adjust
int atr_period_final = atr_period
float atr_mult_final = atr_multiplier
string preset_label = tf_preset
if tf_preset == "Auto-1H/4H"
    atr_period_final := 10
    atr_mult_final := 3.0
    preset_label := "1H/4H"
else if tf_preset == "Auto-1D"
    atr_period_final := 14
    atr_mult_final := 3.0
    preset_label := "Daily"
else if tf_preset == "Auto-1W"
    atr_period_final := 20
    atr_mult_final := 4.0
    preset_label := "Weekly"
// Show settings
if barstate.islast
    label.new(x=bar_index[barstate.isrealtime ? 0 : 50], y=high, text="Preset: " + preset_label + "\nATR: " + str.tostring(atr_period_final) + "\nMult: " + str.tostring(atr_mult_final), color=color.white, style=label.style_label_left, textcolor=color.black, size=size.small, yloc=yloc.abovebar)
// Calculations
atr2 = ta.sma(ta.tr, atr_period_final)
atr = change_atr ? ta.atr(atr_period_final) : atr2
up = src - (atr_mult_final * atr)
up1 = nz(up[1], up)
up := close[1] > up1 ? math.max(up, up1) : up
dn = src + (atr_mult_final * atr)
dn1 = nz(dn[1], dn)
dn := close[1] < dn1 ? math.min(dn, dn1) : dn
trend = 1
trend := nz(trend[1], trend)
trend := trend == -1 and close > dn1 ? 1 : trend == 1 and close < up1 ? -1 : trend
buy_signal = trend == 1 and trend[1] == -1
sell_signal = trend == -1 and trend[1] == 1
ema = ta.ema(close, ema_length)
ema1 = ta.ema(close, dema_length)
dema = 2 * ema1 - ta.ema(ema1, dema_length)
vol_ema = ta.ema(volume, vol_ema_length)
rsi = ta.rsi(close, rsi_length)
// Plots (global)
up_plot = plot(trend == 1 ? up : na, title="Up Trend", style=plot.style_linebr, linewidth=2, color=color.green)
dn_plot = plot(trend == -1 ? dn : na, title="Down Trend", style=plot.style_linebr, linewidth=2, color=color.red)
plot(dema, title="DEMA 200", color=color.blue, style=plot.style_linebr, linewidth=2)
plotshape(buy_signal ? up : na, title="UpTrend Begins", location=location.absolute, style=shape.circle, size=size.tiny, color=color.green)
plotshape(buy_signal and show_signals ? up : na, title="Buy", text="Buy", location=location.absolute, style=shape.labelup, size=size.tiny, color=color.green, textcolor=color.white)
plotshape(sell_signal ? dn : na, title="DownTrend Begins", location=location.absolute, style=shape.circle, size=size.tiny, color=color.red)
plotshape(sell_signal and show_signals ? dn : na, title="Sell", text="Sell", location=location.absolute, style=shape.labeldown, size=size.tiny, color=color.red, textcolor=color.white)
m_plot = plot(ohlc4, title="", style=plot.style_circles, linewidth=1)
long_fill_color = highlighting ? (trend == 1 ? color.new(color.green, 90) : color.white) : color.white
short_fill_color = highlighting ? (trend == -1 ? color.new(color.red, 90) : color.white) : color.white
fill(m_plot, up_plot, title="UpTrend Highlighter", color=long_fill_color)
fill(m_plot, dn_plot, title="DownTrend Highlighter", color=short_fill_color)
plot(ema, title="EMA", color=color.blue, linewidth=2)
// Strategy Logic with Re-Entry (in if for skip)

var float entry_price = na
vol_condition = not use_vol_filter or volume > vol_ema
rsi_condition = not use_rsi_filter or rsi > rsi_threshold
buy_cond_met = buy_signal and close > ema and close > dema and allow_long and vol_condition and rsi_condition
re_entry_cond = trend == 1 and strategy.position_size == 0 and close[1] < ema and close > ema and close > dema and vol_condition and rsi_condition
sell_cond_met = sell_signal and strategy.position_size > 0 and (close < dema or true)
if buy_cond_met or re_entry_cond
    strategy.entry("Long", strategy.long)
    entry_price := close
if sell_cond_met
    strategy.close("Long")
    entry_price := na
if sell_signal and close < ema and close < dema and allow_short and vol_condition
    strategy.entry("Short", strategy.short)
    entry_price := close
if buy_signal and strategy.position_size < 0
    strategy.close("Short")
    entry_price := na
// SL & TP with Trailing
if strategy.position_size != 0 and not na(entry_price)
    if sl_multiplier > 0
        sl_price = strategy.position_size > 0 ? entry_price - (sl_multiplier * atr) : entry_price + (sl_multiplier * atr)
        trail_condition = strategy.position_size > 0 ? (close - entry_price > atr) : (entry_price - close > atr)
        trail_sl = strategy.position_size > 0 ? up : dn
        final_sl = trail_condition ? trail_sl : sl_price
        strategy.exit("SL Exit", stop=final_sl)
    if tp_multiplier > 0
        tp_price = strategy.position_size > 0 ? entry_price + (tp_multiplier * atr) : entry_price - (tp_multiplier * atr)
        strategy.exit("TP Exit", limit=tp_price)
// Alerts
alertcondition(buy_signal, title="SuperTrend Buy", message="SuperTrend Buy!")
alertcondition(sell_signal, title="SuperTrend Sell", message="SuperTrend Sell!")
change_cond = trend != trend[1]
alertcondition(change_cond, title="SuperTrend Direction Change", message="SuperTrend has changed direction!")
相关推荐