
别再用14周期RSI了。这个策略直接把RSI周期压缩到8,配合14点动量阈值,专门捕捉短线爆发。传统RSI策略在震荡市场中反复打脸,而这套组合在高频波动中表现更稳定。
核心逻辑很直接:RSI动量变化>14时触发多头信号,<-14时触发空头信号。同时要求成交量超过13周期均量,确保不是假突破。这种设计比单纯的RSI超买超卖信号提前1-2个周期,抓住趋势启动的黄金时刻。
止盈4.15%,止损1.85%,风险收益比达到2.24:1。这个比例在剥头皮策略中算是激进的,但配合2.55%移动止损,实际风险控制更严格。
关键在于移动止损的设计:一旦价格朝有利方向移动,止损线会跟随最高点/最低点动态调整。这意味着即使没达到4.15%止盈目标,也能锁定大部分利润。实战中,很多交易会在2-3%的位置被移动止损带出,避免了利润回吐。
成交量必须超过13周期均量才能开仓。这个设计过滤掉了90%的假信号。很多RSI策略在低量环境下频繁开仓,结果被来回打脸。
13周期的成交量均线比常见的20周期更敏感,能更快识别资金流入。1倍乘数看起来不高,但结合8周期RSI的快速反应,已经足够筛选出真正的突破机会。
多头入场需要满足三个条件之一:RSI动量>14、RSI从超卖区反弹、RSI上穿超卖线。这种设计比单一条件更灵活,适应不同的市场状态。
超卖线设在10,超买线设在90,比传统的30/70更极端。这样做的好处是减少假信号,坏处是可能错过一些机会。但对于剥头皮策略来说,宁可错过也不要做错。
这套策略最适合加密货币、外汇主要货币对、热门股票等高波动品种。在低波动的蓝筹股或债券上表现会大打折扣。
最佳时间窗口是欧美交易时段重叠期,此时流动性最好,成交量过滤器最有效。亚洲时段由于成交量偏低,信号质量会下降。
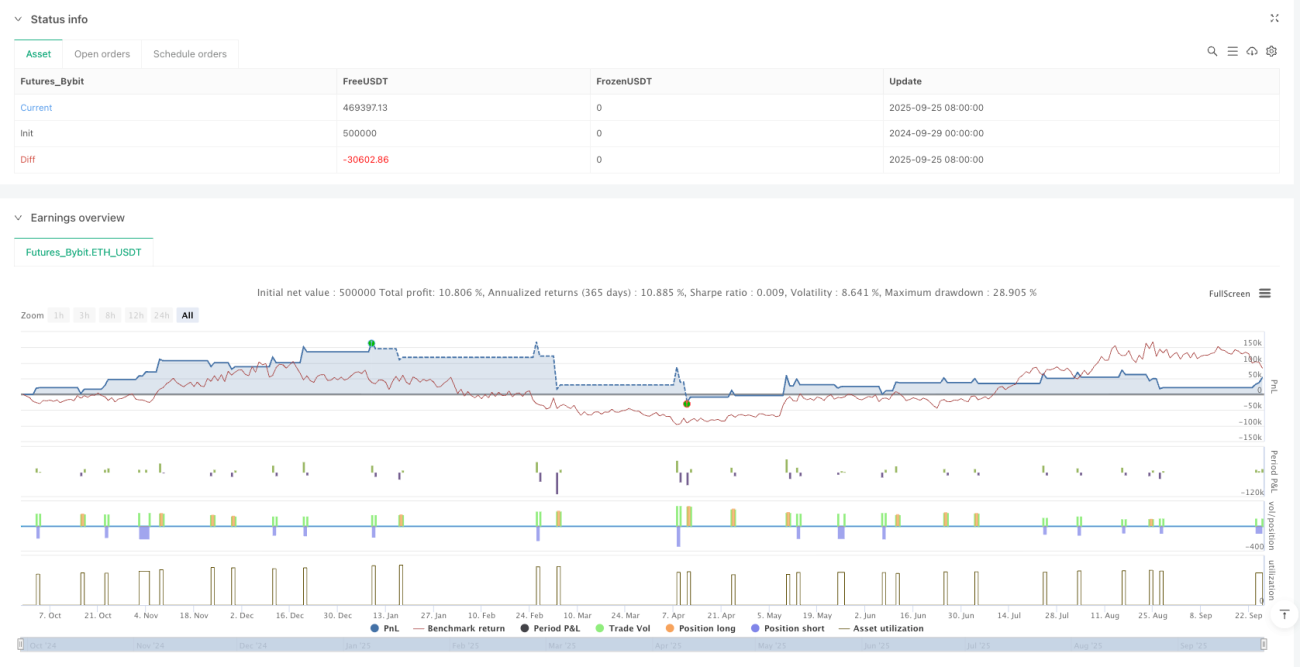
回测数据显示该策略存在连续亏损风险,特别是在横盘震荡市场中。8周期RSI过于敏感,容易在区间震荡中被反复止损。
建议单次风险敞口不超过账户的2%,并在连续3次止损后暂停交易。历史回测不代表未来收益,实盘交易需要严格的资金管理和心理控制。
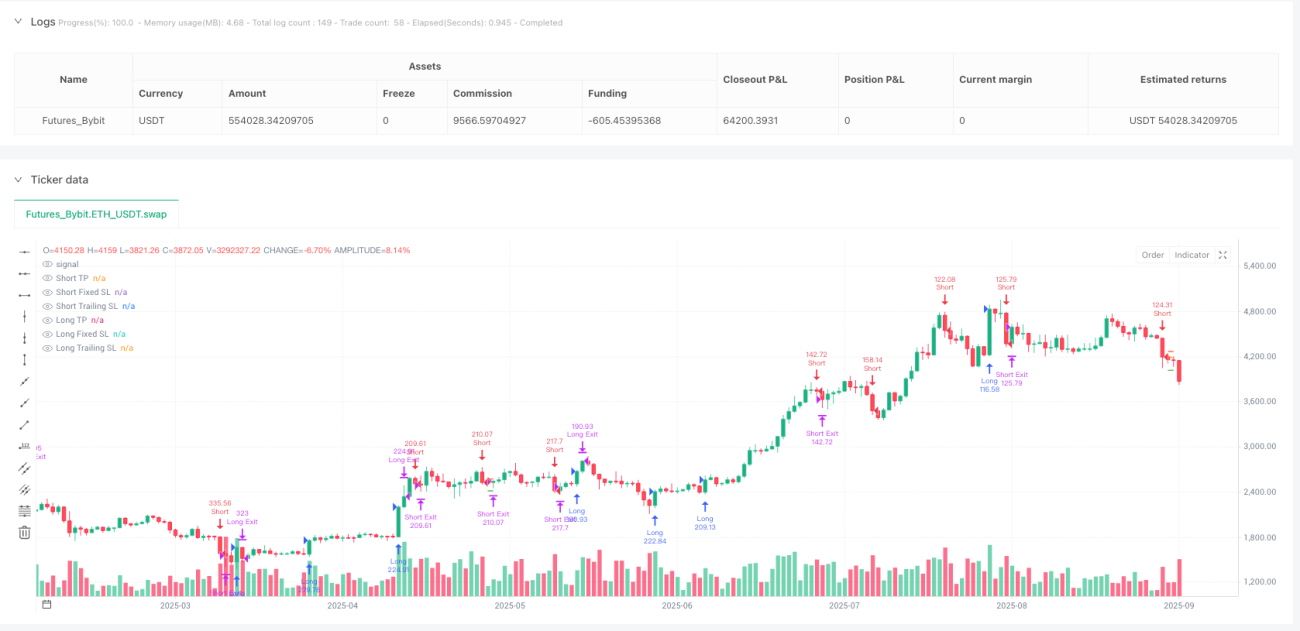
/*backtest
start: 2024-09-29 00:00:00
end: 2025-09-26 08:00:00
period: 1d
basePeriod: 1d
exchanges: [{"eid":"Futures_Bybit","currency":"ETH_USDT","balance":500000}]
*/
// This Pine Script® code is subject to the terms of the Mozilla Public License 2.0 at https://mozilla.org/MPL/2.0/
// © MonkeyPhone
//@version=5
strategy("RSI Momentum Scalper", overlay=true, initial_capital=10000, default_qty_type=strategy.percent_of_equity, default_qty_value=100, commission_type=strategy.commission.percent, commission_value=0.1, calc_on_order_fills=true)
// Trading Mode Selection
tradeMode = input.string("Both", title="Trade Mode", options=["Both", "Long Only", "Short Only"])
// RSI Settings
rsiLength = input.int(8, title="RSI Length", minval=2, maxval=30)
rsiOverbought = input.int(90, title="RSI Overbought", minval=60, maxval=99)
rsiOversold = input.int(10, title="RSI Oversold", minval=1, maxval=40)
rsiMomentumThreshold = input.float(14, title="RSI Momentum Threshold", minval=1, maxval=15, step=0.5)
// Volume Settings
volMultiplier = input.float(1, title="Volume Multiplier", minval=1.0, maxval=3.0, step=0.1)
volLookback = input.int(13, title="Volume MA Length", minval=5, maxval=50)
// Exit Settings
takeProfitPercent = input.float(4.15, title="Take Profit %", minval=0.1, maxval=10.0, step=0.1)
stopLossPercent = input.float(1.85, title="Stop Loss %", minval=0.1, maxval=6.0, step=0.1)
trailingStopPercent = input.float(2.55, title="Trailing Stop %", minval=0.1, maxval=4.0, step=0.05)
// Calculate RSI
rsi = ta.rsi(close, rsiLength)
rsiMA = ta.sma(rsi, 3)
// Calculate RSI Momentum
rsiMomentum = rsi - rsi[1]
// Volume Analysis
volMA = ta.sma(volume, volLookback)
highVolume = volume > volMA * volMultiplier
// Entry Conditions - Long
bullishMomentum = rsiMomentum > rsiMomentumThreshold
oversoldBounce = rsi < rsiOversold and rsi > rsi[1]
bullishCross = ta.crossover(rsi, rsiOversold)
longCondition = (bullishMomentum or oversoldBounce or bullishCross) and highVolume and close > close[1]
// Entry Conditions - Short
bearishMomentum = rsiMomentum < -rsiMomentumThreshold
overboughtReversal = rsi > rsiOverbought and rsi < rsi[1]
bearishCross = ta.crossunder(rsi, rsiOverbought)
shortCondition = (bearishMomentum or overboughtReversal or bearishCross) and highVolume and close < close[1]
// Apply trade mode filter
longEntry = longCondition and (tradeMode == "Both" or tradeMode == "Long Only")
shortEntry = shortCondition and (tradeMode == "Both" or tradeMode == "Short Only")
// Entry Logic
strategy.entry("Long", strategy.long, when=longEntry and strategy.position_size == 0)
strategy.entry("Short", strategy.short, when=shortEntry and strategy.position_size == 0)
// Declare and initialize trailing variables
var float highest_since_long = na
var float lowest_since_short = na
var float long_trailing_level = na
var float short_trailing_level = na
var float long_fixed_sl = na
var float long_tp = na
var float short_fixed_sl = na
var float short_tp = na
// Update trailing levels using ternary operators with math.max/min
highest_since_long := strategy.position_size > 0 ? math.max(na(highest_since_long[1]) ? math.max(high, strategy.position_avg_price) : highest_since_long[1], high) : na
lowest_since_short := strategy.position_size < 0 ? math.min(na(lowest_since_short[1]) ? math.min(low, strategy.position_avg_price) : lowest_since_short[1], low) : na
// Calculate exit levels
long_fixed_sl := strategy.position_size > 0 ? strategy.position_avg_price * (1 - stopLossPercent / 100) : na
long_tp := strategy.position_size > 0 ? strategy.position_avg_price * (1 + takeProfitPercent / 100) : na
long_trailing_level := strategy.position_size > 0 ? highest_since_long * (1 - trailingStopPercent / 100) : na
short_fixed_sl := strategy.position_size < 0 ? strategy.position_avg_price * (1 + stopLossPercent / 100) : na
short_tp := strategy.position_size < 0 ? strategy.position_avg_price * (1 - takeProfitPercent / 100) : na
short_trailing_level := strategy.position_size < 0 ? lowest_since_short * (1 + trailingStopPercent / 100) : na
// Effective stop loss levels
effective_long_sl = strategy.position_size > 0 ? math.max(long_fixed_sl, long_trailing_level) : na
effective_short_sl = strategy.position_size < 0 ? math.min(short_fixed_sl, short_trailing_level) : na
// Exit Logic
strategy.exit("Long Exit", "Long", limit=long_tp, stop=effective_long_sl, when=strategy.position_size > 0)
strategy.exit("Short Exit", "Short", limit=short_tp, stop=effective_short_sl, when=strategy.position_size < 0)
// Plot TP, fixed SL, and trailing SL levels on chart when in position
plot(strategy.position_size > 0 ? long_tp : na, title="Long TP", color=color.green, style=plot.style_linebr)
plot(strategy.position_size > 0 ? long_fixed_sl : na, title="Long Fixed SL", color=color.red, style=plot.style_linebr)
plot(strategy.position_size > 0 ? long_trailing_level : na, title="Long Trailing SL", color=color.orange, style=plot.style_linebr)
plot(strategy.position_size < 0 ? short_tp : na, title="Short TP", color=color.green, style=plot.style_linebr)
plot(strategy.position_size < 0 ? short_fixed_sl : na, title="Short Fixed SL", color=color.red, style=plot.style_linebr)
plot(strategy.position_size < 0 ? short_trailing_level : na, title="Short Trailing SL", color=color.orange, style=plot.style_linebr)
// Alerts
alertcondition(longEntry, title="Long Entry Alert", message="RSI Momentum Long Signal")
alertcondition(shortEntry, title="Short Entry Alert", message="RSI Momentum Short Signal")