 ["abc", "def", {"type": "button", "cmd": "coverAll", "name": "close position"}]
      ]
  })"_json;

  auto ticker = exchange.GetTicker();
  json jsonTicker = R"({"Buy": 0, "Sell": 0, "High": 0, "Low": 0, "Volume": 0, "Last": 0, "Time": 0})"_json;
  jsonTicker["Buy"] = ticker.Buy;
  jsonTicker["Sell"] = ticker.Sell;
  jsonTicker["Last"] = ticker.Last;
  jsonTicker["Volume"] = ticker.Volume;
  jsonTicker["Time"] = ticker.Time;
  jsonTicker["High"] = ticker.High;
  jsonTicker["Low"] = ticker.Low;

  json arr = R"([{"body": {}, "colspan": 2}, "abc"])"_json;
  arr[0]["body"] = jsonTicker;
  table["rows"].push_back(arr);
  LogStatus("`" + table.dump() + "`");
}
)
- Vertical merger
```js
function main() {
var table = {
type: 'table',
title: 'Table demo',
cols: ['ColumnA', 'ColumnB', 'ColumnC'],
rows: [
['A1', 'B1', {'type':'button', 'cmd': 'coverAll', 'name': 'C1'}]
]
}
var ticker = exchange.GetTicker()
var name = exchange.GetName()
table.rows.push([{body : "A2 + B2:" + JSON.stringify(ticker), colspan : 2}, "C2"])
table.rows.push([{body : "A3 + A4 + A5:" + name, rowspan : 3}, "B3", "C3"])
// A3 is merged by the first cell in the previous row
table.rows.push(["B4", "C4"])
// A2 is merged by the first cell in the previous row
table.rows.push(["B5", "C5"])
table.rows.push(["A6", "B6", "C6"])
LogStatus('`' + JSON.stringify(table) + '`')
}
import json
def main():
    table = {
        "type" : "table",
        "title" : "Table demo",
        "cols" : ["ColumnA", "ColumnB", "ColumnC"],
        "rows" : [
            ["A1", "B1", {"type": "button", "cmd": "coverAll", "name": "C1"}]
        ]
    }

    ticker = exchange.GetTicker()
    name = exchange.GetName()

    table["rows"].append([{"body": "A2 + B2:" + json.dumps(ticker), "colspan": 2}, "C2"])
    table["rows"].append([{"body": "A3 + A4 + A5:" + name, "rowspan": 3}, "B3", "C3"])
    table["rows"].append(["B4", "C4"])
    table["rows"].append(["B5", "C5"])
    table["rows"].append(["A6", "B6", "C6"])
    LogStatus("`" + json.dumps(table) + "`")
void main() {
    json table = R"({
        "type" : "table",
        "title" : "Table demo",
        "cols" : ["ColumnA", "ColumnB", "ColumnC"],
        "rows" : [
            ["A1", "B1", {"type": "button", "cmd": "coverAll", "name": "C1"}]
        ]
    })"_json;
    // In order to test, the code is short and easy to read, and the constructed data is used here
    json jsonTicker = R"({"High": 0, "Low": 0, "Buy": 0, "Sell": 0, "Last": 0, "Time": 0, "Volume": 0})"_json;
    auto name = exchange.GetName();
    json arr1 = R"([{"body": "", "colspan": 2}, "C2"])"_json;
    arr1[0]["body"] = "A2 + B2:" + jsonTicker.dump();
    json arr2 = R"([{"body": "", "rowspan": 3}, "B3", "C3"])"_json;
    arr2[0]["body"] = "A3 + A4 + A5:" + name;
    table["rows"].push_back(arr1);
    table["rows"].push_back(arr2);
    table["rows"].push_back(R"(["B4", "C4"])"_json);
    table["rows"].push_back(R"(["B5", "C5"])"_json);
    table["rows"].push_back(R"(["A6", "B6", "C6"])"_json);
    LogStatus("`" + table.dump() + "`");
}
)
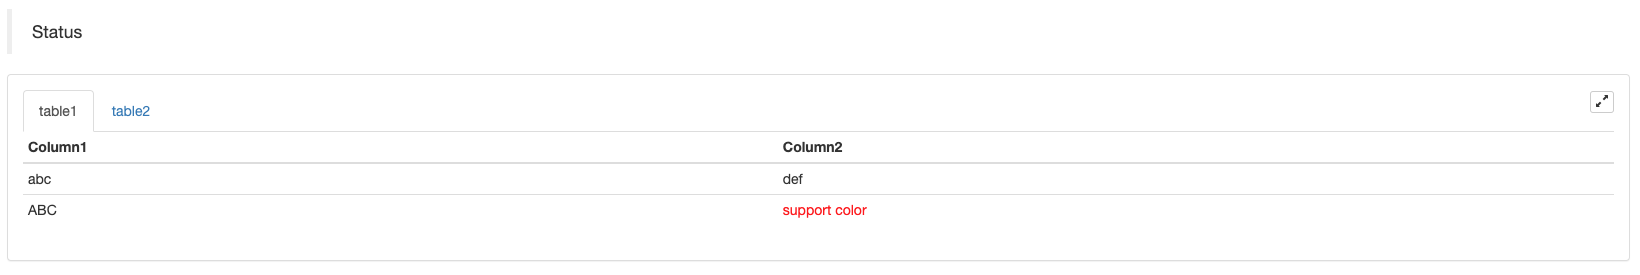
Table pagination display of status bar:
function main() {
    var table1 = {type: 'table', title: 'table1', cols: ['Column1', 'Column2'], rows: [ ['abc', 'def'], ['ABC', 'support color #ff0000']]}
    var table2 = {type: 'table', title: 'table2', cols: ['Column1', 'Column2'], rows: [ ['abc', 'def'], ['ABC', 'support color #ff0000']]}
    LogStatus('`' + JSON.stringify([table1, table2]) + '`')
}
import json
def main():
    table1 = {"type": "table", "title": "table1", "cols": ["Column1", "Column2"], "rows": [ ["abc", "def"], ["ABC", "support color #ff0000"]]}
    table2 = {"type": "table", "title": "table2", "cols": ["Column1", "Column2"], "rows": [ ["abc", "def"], ["ABC", "support color #ff0000"]]}
    LogStatus("`" + json.dumps([table1, table2]) + "`")
void main() {
    json table1 = R"({"type": "table", "title": "table1", "cols": ["Column1", "Column2"], "rows": [ ["abc", "def"], ["ABC", "support color #ff0000"]]})"_json;
    json table2 = R"({"type": "table", "title": "table2", "cols": ["Column1", "Column2"], "rows": [ ["abc", "def"], ["ABC", "support color #ff0000"]]})"_json;
    json arr = R"([])"_json;
    arr.push_back(table1);
    arr.push_back(table2);
    LogStatus("`" + arr.dump() + "`");
}
In addition to paginating tables, multiple tables can be arranged from top to bottom.
function main(){
    var tab1 = {
        type : "table",
        title : "table1",
        cols : ["1", "2"],
        rows : []
    }
    var tab2 = {
        type : "table",
        title : "table2",
        cols : ["1", "2", "3"],
        rows : []
    }
    var tab3 = {
        type : "table",
        title : "table3",
        cols : ["A", "B", "C"],
        rows : []
    }

    tab1.rows.push(["jack", "lucy"])
    tab2.rows.push(["A", "B", "C"])
    tab3.rows.push(["A", "B", "C"])

    LogStatus('`' + JSON.stringify(tab1) + '`\n' +
        '`' + JSON.stringify(tab2) + '`\n' +
        '`' + JSON.stringify(tab3) + '`')

    Log("exit")
}
import json
def main():
    tab1 = {
        "type": "table",
        "title": "table1",
        "cols": ["1", "2"],
        "rows": []
    }
    tab2 = {
        "type": "table",
        "title": "table2",
        "cols": ["1", "2", "3"],
        "rows": []
    }
    tab3 = {
        "type": "table",
        "title": "table3",
        "cols": ["A", "B", "C"],
        "rows": []
    }

    tab1["rows"].append(["jack", "lucy"])
    tab2["rows"].append(["A", "B", "C"])
    tab3["rows"].append(["A", "B", "C"])
    LogStatus("`" + json.dumps(tab1) + "`\n" +
        "`" + json.dumps(tab2) + "`\n" +
        "`" + json.dumps(tab3) + "`")
void main() {
    json tab1 = R"({
        "type": "table",
        "title": "table1",
        "cols": ["1", "2"],
        "rows": []
    })"_json;
    json tab2 = R"({
        "type": "table",
        "title": "table2",
        "cols": ["1", "2", "3"],
        "rows": []
    })"_json;
    json tab3 = R"({
        "type": "table",
        "title": "table3",
        "cols": ["A", "B", "C"],
        "rows": []
    })"_json;
    tab1["rows"].push_back(R"(["jack", "lucy"])"_json);
    tab2["rows"].push_back(R"(["A", "B", "C"])"_json);
    tab3["rows"].push_back(R"(["A", "B", "C"])"_json);
    LogStatus("`" + tab1.dump() + "`\n" +
        "`" + tab2.dump() + "`\n" +
        "`" + tab3.dump() + "`");
}
Operation result:
)
Note:
When the strategy bot is running on the bot page, if you scroll through the history records, the status bar will enter a dormant state and stop updating. The status bar data will only refresh when the log is on the first page.
The status bar supports outputting images coded in base64, and also supports outputting the images coded in base64 in the displayed tablets. Because the length of the string of the encoded image is normally very long, no sample code is provided.
EnableLog()
EnableLog(IsEnable) turns on or off the log recording for order information. Parameter value: isEnable is of bool type. If IsEnable is set to false, the order log will not be printed and it will not be written to the bot database.
Chart(…)
Chart(...), function of customizing charts drawing.
Chart({…}); the parameter is the HighCharts.StockChart parameters of HighStocks that can be serialized in JSON, adding a _isStock attribute to the native parameter. If you specify _isStock:false, it will be displayed as a normal chart.
Note:
If you set the attribute of _isStock to false, the chart used is: Highcharts, as shown in the chart:
)
If we set the attribute of _isStock to true, the chart used is: Highstocks (default_isStock as true), as shown in the chart:
)
To return to the object, you can call add(n, data) (n (such as 0) is the index of series, and data is the data written in the chart) to add data to the specified index series; call reset() to clear the chart data, and reset can take a numeric parameter and specify the number of reserved items.
You can call add(n, data, i) (i is the index of this data in the series) to change the data in the corresponding series.
It can be negative, “-1” refers to the last one, and “-2” is the penultimate one. For example, when drawing a line, modify the data at the last point of the line:
chart.add(0, [1574993606000, 13.5], -1), change the data of the last point of series[0].data.
For it supports to display multiple charts, you only need to pass in array parameters during configuration, such as: var chart = Chart([{…}, {…}, {…}]). For example, chart 1 has two series, chart 2 has one series, and chart 3 has one series. Then, specify series ID 0 and 1 when adding represents to update the data of two order Columns of chart 1; specifying the series ID 2 when adding refers to the first series of chart 2 Data; specifying the series ID3 refers to the data of the first series of chart 3.
HighStocks: http://api.highcharts.com/highstock
Attribute settings related to multi-chart display: example
For example, the chart configuration objects:
var cfgA = {
    extension: {
        // It does not participate in grouping, displayed separately, and its default is 'group'
        layout: 'single',
        // This is the specified height, which can be set to string "300px" (set "300", and "300px" will be displayed instead automatically)
        height: 300,
        // It is the unit value of the specified width, with a total value of 12
        col: 8
    },
    title: {
        text: 'Market Chart'
    },
    xAxis: {
        type: 'datetime'
    },
    series: [{
        name: 'Buy 1',
        data: []
    }, {
        name: 'Sell 1',
        data: []
    }]
}

var cfgB = {
    title: {
        text: 'Spread chart'
    },
    xAxis: {
        type: 'datetime'
    },
    series: [{
        name: 'Spread',
        type: 'column',
        data: []
    }]
}

var cfgC = {
    _isStock: false,
    title: {
        text: 'Pie Chart'
    },
    series: [{
        type: 'pie',
        name: 'one',
        // After specifying the initial data, you don't need to update it with the "add" function; Changing the chart configuration directly will update the series
        data: [
            ["A", 25],
            ["B", 25],
            ["C", 25],
            ["D", 25]
        ]
    }]
}

var cfgD = {
    extension: {
        layout: 'single',
        // The unit value of the specified width, with a total value of 12
        col: 8,
        height: '300px'
    },
    title: {
        text: 'Market Chart'
    },
    xAxis: {
        type: 'datetime'
    },
    series: [{
        name: 'Buy 1',
        data: []
    }, {
        name: 'Sell 1',
        data: []
    }]
}

var cfgE = {
    __isStock: false,
    extension: {
        layout: 'single',
        col: 4,
        height: '300px'
    },
    title: {
        text: 'Pie Chart2'
    },
    series: [{
        type: 'pie',
        name: 'one',
        data: [
            ["A", 25],
            ["B", 25],
            ["C", 25],
            ["D", 25]
        ]
    }]
}
cfgA = {
    "extension" : {
        "layout" : "single",
        "height" : 300,
        "col" : 8
    },
    "title" : {
        "text" : "Market Chart"
    },
    "xAxis" : {
        "type" : "datetime"
    },
    "series" : [{
        "name" : "Buy 1",
        "data" : []
    }, {
        "name" : "Sell 1",
        "data" : []
    }]
}

cfgB = {
    "title" : {
        "text" : "Spread chart"
    },
    "xAxis" : {
        "type" : "datetime"
    },
    "series" : [{
        "name" : "Spread",
        "type" : "column",
        "data" : []
    }]
}

cfgC = {
    "__isStock" : False,
    "title" : {
        "text" : "Pie Chart"
    },
    "series" : [{
        "type" : "pie",
        "name" : "one",
        "data" : [
            ["A", 25],
            ["B", 25],
            ["C", 25],
            ["D", 25]
        ]
    }]
}

cfgD = {
    "extension" : {
        "layout" : "single",
        "col" : 8,
        "height" : "300px"
    },
    "title" : {
        "text" : "Market Chart"
    },
    "series" : [{
        "name" : "Buy 1",
        "data" : []
    }, {
        "name" : "Sell 1",
        "data" : []
    }]
}

cfgE = {
    "__isStock" : False,
    "extension" : {
        "layout" : "single",
        "col" : 4,
        "height" : "300px"
    },
    "title" : {
        "text" : "Pie Chart2"
    },
    "series" : [{
        "type" : "pie",
        "name" : "one",
        "data" : [
            ["A", 25],
            ["B", 25],
            ["C", 25],
            ["D", 25]
        ]
    }]
}
json cfgA = R"({
    "extension" : {
        "layout" : "single",
        "height" : 300,
        "col" : 8
    },
    "title" : {
        "text" : "Market Chart"
    },
    "xAxis" : {
        "type" : "datetime"
    },
    "series" : [{
        "name" : "Buy 1",
        "data" : []
    }, {
        "name" : "Sell 1",
        "data" : []
    }]
})"_json;

json cfgB = R"({
    "title" : {
        "text" : "Spread chart"
    },
    "xAxis" : {
        "type" : "datetime"
    },
    "series" : [{
        "name" : "Spread",
        "type" : "column",
        "data" : []
    }]
})"_json;

json cfgC = R"({
    "__isStock" : false,
    "title" : {
        "text" : "Pie Chart"
    },
    "series" : [{
        "type" : "pie",
        "name" : "one",
        "data" : [
            ["A", 25],
            ["B", 25],
            ["C", 25],
            ["D", 25]
        ]
    }]
})"_json;

json cfgD = R"({
    "extension" : {
        "layout" : "single",
        "col" : 8,
        "height" : "300px"
    },
    "title" : {
        "text" : "Market Chart"
    },
    "series" : [{
        "name" : "Buy 1",
        "data" : []
    }, {
        "name" : "Sell 1",
        "data" : []
    }]
})"_json;

json cfgE = R"({
    "__isStock" : false,
    "extension" : {
        "layout" : "single",
        "col" : 4,
        "height" : "300px"
    },
    "title" : {
        "text" : "Pie Chart2"
    },
    "series" : [{
        "type" : "pie",
        "name" : "one",
        "data" : [
            ["A", 25],
            ["B", 25],
            ["C", 25],
            ["D", 25]
        ]
    }]
})"_json;
-
cfgA.extension.layoutattributeIf this attribute is set and the value is “single”, the chart will not be superimposed (it will not be displayed as a tabbed label) and will be displayed separately (tiled display).
-
cfgA.extension.heightattributeThis attribute is used to set the height of the chart. The value can be a numeric type, or set to “300px” mode.
-
cfgA.extension.colattributeThis attribute is used to set the width of the chart. The page width is divided into 12 units in total, and setting “8” means that the chart occupies 8 units of width.
Run the complete example strategy:
The effect display of the chart configuration objects in the above examples:
)
)
-
For the data on the chart configuration objects, modify the chart configuration directly, and then update the chart to realize the data update:
For example, in the
JavaScriptcode part of the example (Complete Example):cfgC.series[0].data[0][1] = Math.random() * 100 cfgE.series[0].data[0][1] = Math.random() * 100 // "Update" is actually equivalent to resetting the configuration of the chart chart.update([cfgA, cfgB, cfgC, cfgD, cfgE])Update the data by
addmethod, such as adding an item to the pie chart, and here follows theJavaScriptcode part of the example (Complete Example):// Add a data point to the pie chart; "add" can only update the data points added by the "add" method, the built-in data points cannot be updated later chart.add(3, { name: "ZZ", y: Math.random() * 100 }) -
Attached usage examples of
ChartfunctionSimple drawing example:
// This chart is an object in JavaScript language. Before using the "Chart" function, we need to declare an object variable of a chart configuration
var chart = {
    // It is marked as a general chart; if you are interested, you can change it to false and run it
    __isStock: true,
    // Zoom tool
    tooltip: {xDateFormat: '%Y-%m-%d %H:%M:%S, %A'},
    // Title
    title : { text : 'Spread analysis chart'},
    // Choose a range
    rangeSelector: {
        buttons:  [{type: 'hour',count: 1, text: '1h'}, {type: 'hour',count: 3, text: '3h'}, {type: 'hour', count: 8, text: '8h'}, {type: 'all',text: 'All'}],
        selected: 0,
        inputEnabled: false
    },
    // The horizontal axis of the coordinate axis is: x axis, and the currently set "Types of" is: time
    xAxis: { type: 'datetime'},
    // The vertical axis of the coordinate axis is: y axis, and the default value is adjusted with the data size
    yAxis : {
        // Title
        title: {text: 'Spread'},
        // Whether to enable the right vertical axis
        opposite: false
    },
    // Data system column; this attribute holds each data system column (line, K-line diagram, label, etc.)
    series : [
        // The index is 0, and the data in the data column is stored in the data array.
        {name : "line1", id : "line 1,buy1Price", data : []},
        // The index is 1, and set dashStyle: 'shortdash', namely: set the dashed line
        {name : "line2", id : "line 2,lastPrice", dashStyle : 'shortdash', data : []}
    ]
}
function main(){
    // Call the "Chart" function to initialize the chart
    var ObjChart = Chart(chart)
    // Empty
    ObjChart.reset()
    while(true){
        // Get the timestamp of this polling, that is, a millisecond timestamp, used to determine the position of the X axis written to the chart
        var nowTime = new Date().getTime()
        // Get market data
        var ticker = _C(exchange.GetTicker)
        // Get "Buy 1" price from the return value of market data
        var buy1Price = ticker.Buy
        // To obtain the last executed price, in order to avoid the overlap of the 2 lines, we add 1
        var lastPrice = ticker.Last + 1
        // Use timestamp as X value and "Buy 1" price as Y value, and pass them into the data sequence of index 0
        ObjChart.add(0, [nowTime, buy1Price])
        // Same as above
        ObjChart.add(1, [nowTime, lastPrice])
        Sleep(2000)
    }
}
import time chart = { "__isStock" : True, "tooltip" : {"xDateFormat" : "%Y-%m-%d %H:%M:%S, %A"}, "title" : {"text" : "Spread analysis chart"}, "rangeSelector" : { "buttons" : [{"type": "count", "count": 1, "text": "1h"}, {"type": "hour", "count": 3, "text": "3h"}, {"type": "hour", "count": 8, "text": "8h"}, {"type": "all", "text": "All"}], "selected": 0, "inputEnabled": False }, "xAxis": {"type": "datetime"}, "yAxis": { "title": {"text": "Spread"}, "opposite": False }, "series": [{ "name": "line1", "id": "line 1,buy1Price", "data": [] }, { "name": "line2", "id": "line 2,lastPrice", "dashStyle": "shortdash", "data": [] }] } def main(): ObjChart = Chart(chart) ObjChart.reset() while True: nowTime = time.time() * 1000 ticker = exchange.GetTicker() buy1Price = ticker["Buy"] lastPrice = ticker["Last"] + 1 ObjChart.add(0, [nowTime, buy1Price]) ObjChart.add(1, [nowTime, lastPrice]) Sleep(2000)void main() { // When write strategies in C++, try not to declare global variables that are not basic types, so the declaration of the chart configuration objects is in the "main" function json chart = R"({ "__isStock" : true, "tooltip" : {"xDateFormat" : "%Y-%m-%d %H:%M:%S, %A"}, "title" : {"text" : "Spread analysis chart"}, "rangeSelector" : { "buttons" : [{"type": "count", "count": 1, "text": "1h"}, {"type": "hour", "count": 3, "text": "3h"}, {"type": "hour", "count": 8, "text": "8h"}, {"type": "all", "text": "All"}], "selected": 0, "inputEnabled": false }, "xAxis": {"type": "datetime"}, "yAxis": { "title": {"text": "Spread"}, "opposite": false }, "series": [{ "name": "line1", "id": "line 1,buy1Price", "data": [] }, { "name": "line2", "id": "line 2,lastPrice", "dashStyle": "shortdash", "data": [] }] })"_json; auto ObjChart = Chart(chart); ObjChart.reset(); while(true) { auto nowTime = Unix() * 1000; auto ticker = exchange.GetTicker(); auto buy1Price = ticker.Buy; auto lastPrice = ticker.Last + 1.0; ObjChart.add(0, {nowTime, buy1Price}); ObjChart.add(1, {nowTime, lastPrice}); Sleep(2000); } }The example of drawing trigonometric curve:
// The object used to initialize the chart
var chart = {
    // Chart title
    title: {text: "line value triggers plotLines value"},
    // The related settings of Y axis
    yAxis: {
        // The horizontal line perpendicular to y axis, used as a trigger line, is an array of structures where multiple trigger lines can be set
        plotLines: [{
            // Trigger line value; set a number, and this line will be displayed in the corresponding numerical position
            value: 0,
            // Set the color of the trigger line
            color: 'red',
            // Width
            width: 2,
            // Labels displayed
            label: {
                // Label text
                text: 'Trigger value',
                // Center label position
                align: 'center'
            }
        }]
    },
    // The related settings of X axis, and here the setting type is the time axis
    xAxis: {type: "datetime"},
    series: [
        {name: "sin", type: "spline", data: []},
        // This is a more important data system column; you can set multiple data system column, according to the array index control
        {name: "cos", type: "spline", data: []}
    ]
}
function main(){
    // Pi
    var pi = 3.1415926535897
    // Variable for recording timestamp
    var time = 0
    // Angle
    var angle = 0
    // Coordinate y value, used to receive sine and cosine values
    var y = 0
    // Call the API to initialize charts with "chart" objects
    var objChart = Chart(chart)
    // When initializing, clear the chart
    objChart.reset()
    // Set the value of the trigger line to 1
    chart.yAxis.plotLines[0].value = 1
    // Loop
    while(true){
        // Get the timestamp of the current moment
        time = new Date().getTime()
        // The angle is increased by 5 degrees every 500ms, and the sine value is calculated
        y = Math.sin(angle * 2 * pi / 360)
        // Write the calculated y value to the data of the corresponding index of the chart; the first parameter of the "add" function is the specified index
        objChart.add(0, [time, y])
        // Calculate the cosine value
        y = Math.cos(angle * 2 * pi / 360)
        objChart.add(1, [time, y])
        // Increase by 5 degrees
        angle += 5
        // Pause for 5 seconds, to avoid drawing too frequently and the data growing too fast
        Sleep(5000)
    }
}
import math import time chart = { "title": {"text": "line value triggers plotLines value"}, "yAxis": { "plotLines": [{ "value": 0, "color": "red", "width": 2, "label": { "text": "Trigger value", "align": "center" } }] }, "xAxis": {"type": "datetime"}, "series": [{"name": "sin", "type": "spline", "data": []}, {"name": "cos", "type": "spline", "data": []}] } def main(): pi = 3.1415926535897 ts = 0 angle = 0 y = 0 objChart = Chart(chart) objChart.reset() chart["yAxis"]["plotLines"][0]["value"] = 1 while True: ts = time.time() * 1000 y = math.sin(angle * 2 * pi / 360) objChart.add(0, [ts, y]) y = math.cos(angle * 2 * pi / 360) objChart.add(1, [ts, y]) angle += 5 Sleep(5000)void main() { json chart = R"({ "title": {"text": "line value triggers plotLines value"}, "yAxis": { "plotLines": [{ "value": 0, "color": "red", "width": 2, "label": { "text": "Trigger value", "align": "center" } }] }, "xAxis": {"type": "datetime"}, "series": [{"name": "sin", "type": "spline", "data": []}, {"name": "cos", "type": "spline", "data": []}] })"_json; auto pi = 3.1415926535897; auto ts = 0; auto angle = 0.0; auto y = 0.0; auto objChart = Chart(chart); objChart.reset(); chart["yAxis"]["plotLines"][0]["value"] = 1; while(true) { ts = Unix() * 1000; y = sin(angle * 2 * pi / 360); objChart.add(0, {ts, y}); y = cos(angle * 2 * pi / 360); objChart.add(1, {ts, y}); angle += 5; Sleep(5000); } }In the
cppstrategy, theChartfunction can also use an encoded string to configure the chart:void main () { Chart c = Chart(R"EOF({"chart":{"type":"line"},"title":{"text":"Simple chart"},"xAxis":{"title":{"text":"Date"}},"yAxis":{"title":{"text":"Number"}},"series":[{"name":"number","data":[]}]})EOF"); c.reset(); for (size_t i = 0; i < 10; i++) { // For example, int64 of "sprintf" function has different parameters in 32-bit and 64-bit, so it is best to use "toString" to transfer the platform-related types into strings and then pass c.add(0, format("[%s, %d]", toString(Unix() + i).c_str(), rand() % 100)); } })
-
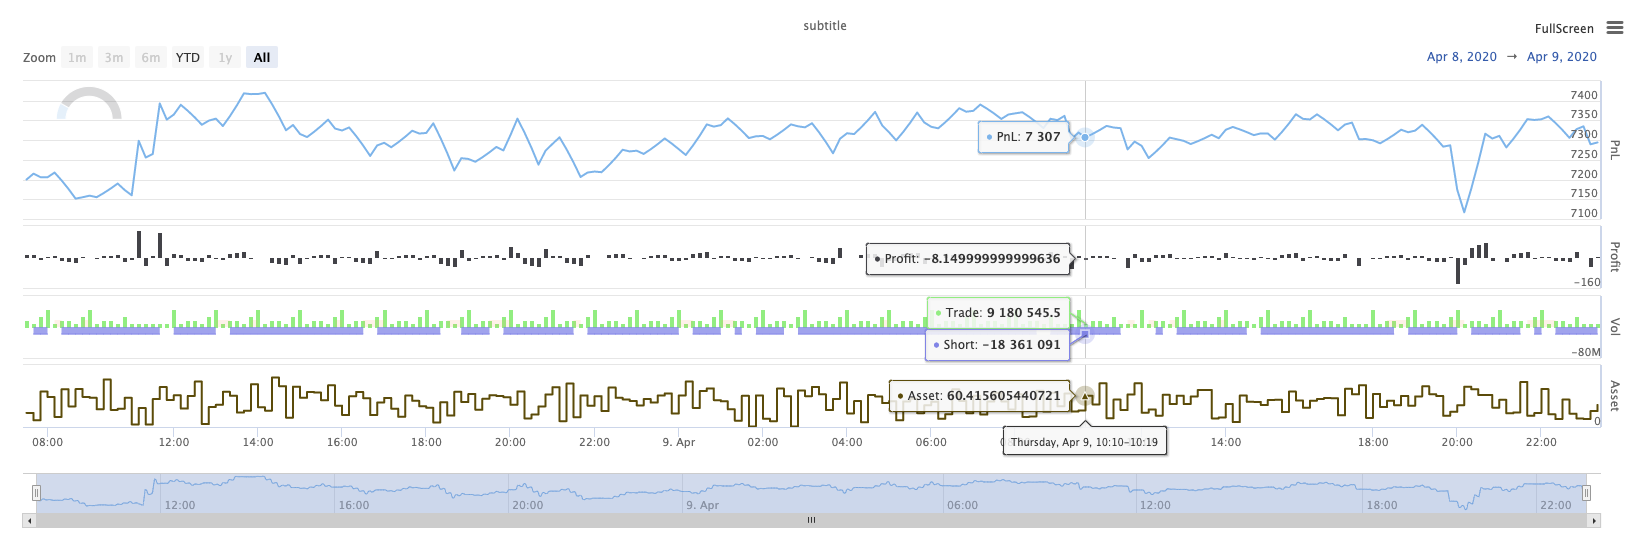
A complex example of mixed charts JavaScript Strategy Address
/*backtest
start: 2020-03-11 00:00:00
end: 2020-04-09 23:59:00
period: 1d
exchanges: [{"eid":"Bitfinex","currency":"BTC_USD"}]
*/

var chartCfg = {
    subtitle: {
        text: "subtitle",
    },
    yAxis: [{
        height: "40%",
        lineWidth: 2,
        title: {
            text: 'PnL',
        },
        tickPixelInterval: 20,
        minorGridLineWidth: 1,
        minorTickWidth: 0,
        opposite: true,
        labels: {
            align: "right",
            x: -3,
        }
    }, {
        title: {
            text: 'Profit',
        },
        top: "42%",
        height: "18%",
        offset: 0,
        lineWidth: 2
    }, {
        title: {
            text: 'Vol',
        },
        top: '62%',
        height: '18%',
        offset: 0,
        lineWidth: 2
    }, {
        title: {
            text: 'Asset',
        },
        top: '82%',
        height: '18%',
        offset: 0,
        lineWidth: 2
    }],
    series: [{
        name: 'PnL',
        data: [],
        id: 'primary',
        tooltip: {
            xDateFormat: '%Y-%m-%d %H:%M:%S'
        },
        yAxis: 0
    }, {
        type: 'column',
        lineWidth: 2,
        name: 'Profit',
        data: [],
        yAxis: 1,
    }, {
        type: 'column',
        name: 'Trade',
        data: [],
        yAxis: 2
    }, {
        type: 'area',
        step: true,
        lineWidth: 0,
        name: 'Long',
        data: [],
        yAxis: 2
    }, {
        type: 'area',
        step: true,
        lineWidth: 0,
        name: 'Short',
        data: [],
        yAxis: 2
    }, {
        type: 'line',
        step: true,
        color: '#5b4b00',
        name: 'Asset',
        data: [],
        yAxis: 3
    }, {
        type: 'pie',
        innerSize: '70%',
        name: 'Random',
        data: [],
        center: ['3%', '6%'],
        size: '15%',
        dataLabels: {
            enabled: false
        },
        startAngle: -90,
        endAngle: 90,
    }],
};

function main() {
    let c = Chart(chartCfg);
    let preTicker = null;
    while (true) {
        let t = exchange.GetTicker();

        c.add(0, [t.Time, t.Last]); // PnL
        c.add(1, [t.Time, preTicker ? t.Last - preTicker.Last : 0]); // profit
        let r = Math.random();
        var pos = parseInt(t.Time/86400);
        c.add(2, [t.Time, pos/2]); // Vol
        c.add(3, [t.Time, r > 0.8 ? pos : null]); // Long
        c.add(4, [t.Time, r < 0.8 ? -pos : null]); // Short
        c.add(5, [t.Time, Math.random() * 100]); // Asset
        // update pie
        chartCfg.series[chartCfg.series.length-1].data = [
            ["A", Math.random()*100],
            ["B", Math.random()*100],
         ];
        c.update(chartCfg)
        preTicker = t;
    }
}
'''backtest
start: 2020-03-11 00:00:00
end: 2020-04-09 23:59:00
period: 1d
exchanges: [{"eid":"Bitfinex","currency":"BTC_USD"}]
'''

import random

chartCfg = {
    "subtitle": {
        "text": "subtitle"
    },
    "yAxis": [{
        "height": "40%",
        "lineWidth": 2,
        "title": {
            "text": 'PnL'
        },
        "tickPixelInterval": 20,
        "minorGridLineWidth": 1,
        "minorTickWidth": 0,
        "opposite": True,
        "labels": {
            "align": "right",
            "x": -3
        }
    }, {
        "title": {
            "text": 'Profit'
        },
        "top": "42%",
        "height": "18%",
        "offset": 0,
        "lineWidth": 2
    }, {
        "title": {
            "text": 'Vol'
        },
        "top": '62%',
        "height": '18%',
        "offset": 0,
        "lineWidth": 2
    }, {
        "title": {
            "text": 'Asset'
        },
        "top": '82%',
        "height": '18%',
        "offset": 0,
        "lineWidth": 2
    }],
    "series": [{
        "name": 'PnL',
        "data": [],
        "id": 'primary',
        "tooltip": {
            "xDateFormat": '%Y-%m-%d %H:%M:%S'
        },
        "yAxis": 0
    }, {
        "type": 'column',
        "lineWidth": 2,
        "name": 'Profit',
        "data": [],
        "yAxis": 1
    }, {
        "type": 'column',
        "name": 'Trade',
        "data": [],
        "yAxis": 2
    }, {
        "type": 'area',
        "step": True,
        "lineWidth": 0,
        "name": 'Long',
        "data": [],
        "yAxis": 2
    }, {
        "type": 'area',
        "step": True,
        "lineWidth": 0,
        "name": 'Short',
        "data": [],
        "yAxis": 2
    }, {
        "type": 'line',
        "step": True,
        "color": '#5b4b00',
        "name": 'Asset',
        "data": [],
        "yAxis": 3
    }, {
        "type": 'pie',
        "innerSize": '70%',
        "name": 'Random',
        "data": [],
        "center": ['3%', '6%'],
        "size": '15%',
        "dataLabels": {
            "enabled": False
        },
        "startAngle": -90,
        "endAngle": 90
    }]
}

def main():
    c = Chart(chartCfg)
    preTicker = None
    while True:
        t = exchange.GetTicker()
        c.add(0, [t["Time"], t["Last"]])
        profit = t["Last"] - preTicker["Last"] if preTicker else 0
        c.add(1, [t["Time"], profit])
        r = random.random()
        pos = t["Time"] / 86400
        c.add(2, [t["Time"], pos / 2])
        long = pos if r > 0.8 else None
        c.add(3, [t["Time"], long])
        short = -pos if r < 0.8 else None
        c.add(4, [t["Time"], short])
        c.add(5, [t["Time"], random.random() * 100])

        # update pie
        chartCfg["series"][len(chartCfg["series"]) - 1]["data"] = [
            ["A", random.random() * 100],
            ["B", random.random() * 100]
        ]
        c.update(chartCfg)
        preTicker = t
/*backtest
start: 2020-03-11 00:00:00
end: 2020-04-09 23:59:00
period: 1d
exchanges: [{"eid":"Bitfinex","currency":"BTC_USD"}]
*/

void main() {
    json chartCfg = R"({
        "subtitle": {
            "text": "subtitle"
        },
        "yAxis": [{
            "height": "40%",
            "lineWidth": 2,
            "title": {
                "text": "PnL"
            },
            "tickPixelInterval": 20,
            "minorGridLineWidth": 1,
            "minorTickWidth": 0,
            "opposite": true,
            "labels": {
                "align": "right",
                "x": -3
            }
        }, {
            "title": {
                "text": "Profit"
            },
            "top": "42%",
            "height": "18%",
            "offset": 0,
            "lineWidth": 2
        }, {
            "title": {
                "text": "Vol"
            },
            "top": "62%",
            "height": "18%",
            "offset": 0,
            "lineWidth": 2
        }, {
            "title": {
                "text": "Asset"
            },
            "top": "82%",
            "height": "18%",
            "offset": 0,
            "lineWidth": 2
        }],
        "series": [{
            "name": "PnL",
            "data": [],
            "id": "primary",
            "tooltip": {
                "xDateFormat": "%Y-%m-%d %H:%M:%S"
            },
            "yAxis": 0
        }, {
            "type": "column",
            "lineWidth": 2,
            "name": "Profit",
            "data": [],
            "yAxis": 1
        }, {
            "type": "column",
            "name": "Trade",
            "data": [],
            "yAxis": 2
        }, {
            "type": "area",
            "step": true,
            "lineWidth": 0,
            "name": "Long",
            "data": [],
            "yAxis": 2
        }, {
            "type": "area",
            "step": true,
            "lineWidth": 0,
            "name": "Short",
            "data": [],
            "yAxis": 2
        }, {
            "type": "line",
            "step": true,
            "color": "#5b4b00",
            "name": "Asset",
            "data": [],
            "yAxis": 3
        }, {
            "type": "pie",
            "innerSize": "70%",
            "name": "Random",
            "data": [],
            "center": ["3%", "6%"],
            "size": "15%",
            "dataLabels": {
                "enabled": false
            },
            "startAngle": -90,
            "endAngle": 90
        }]
    })"_json;

    Chart c = Chart(chartCfg);
    Ticker preTicker;
    while(true) {
        auto t = exchange.GetTicker();
        c.add(0, {t.Time, t.Last});
        auto profit = preTicker.Valid ? t.Last - preTicker.Last : 0;
        c.add(1, {t.Time, profit});
        auto r = rand() % 100;
        auto pos = t.Time / 86400.0;
        c.add(2, {t.Time, pos / 2.0});
        auto longPos = r > 0.8 ? pos : NULL;
        c.add(3, {t.Time, longPos});
        auto shortPos = r < 0.8 ? -pos : NULL;
        c.add(4, {t.Time, shortPos});
        c.add(5, {t.Time, rand() % 100});

        // update pie
        json pie = R"([["A", 0], ["B", 0]])"_json;
        pie[0][1] = rand() % 100;
        pie[1][1] = rand() % 100;
        chartCfg["series"][chartCfg["series"].size() - 1]["data"] = pie;

        c.update(chartCfg);
        preTicker = t;
    }
}
Among the charts, the pie chart is a chart without time axis, and the chart configuration needs to be updated directly when updating data. For example, the code in the above example, after updating the data, use c.update(chartCfg) to update the chart as follows:
    // update pie
    chartCfg.series[chartCfg.series.length-1].data = [
        ["A", Math.random()*100],
        ["B", Math.random()*100],
    ];
    c.update(chartCfg)
    # update pie
    chartCfg["series"][len(chartCfg["series"]) - 1]["data"] = [
        ["A", random.random() * 100],
        ["B", random.random() * 100]
    ]
    c.update(chartCfg)
    // update pie
    json pie = R"([["A", 0], ["B", 0]])"_json;
    pie[0][1] = rand() % 100;
    pie[1][1] = rand() % 100;
    chartCfg["series"][chartCfg["series"].size() - 1]["data"] = pie;
    c.update(chartCfg);
Operation Result:
KLineChart(…)
KLineChart(chartCfg), this function is used to use a drawing method similar to Pine language for custom drawing when the strategy is running. The strategy custom drawing can only use the KLineChart() method or one of the Chart() methods.
Code for reference:
function main() {
    // Call the KLineChart function to create a chart control object c
    let c = KLineChart({
        overlay: true
    })

    // Use the spot exchange object test to obtain K-line data. If you use the futures exchange object test, you need to set up the contract first.
    let bars = exchange.GetRecords()
    if (!bars) {
        return
    }

    bars.forEach(function(bar, index) {
        c.begin(bar)
        c.barcolor(bar.Close > bar.Open ? 'rgba(255, 0, 0, 0.2)' : 'rgba(0, 0, 0, 0.2)')
        if (bar.Close > bar.Open) {
            c.bgcolor('rgba(0, 255, 0, 0.5)')
        }
        let h = c.plot(bar.High, 'high')
        let l = c.plot(bar.Low, 'low')

        c.fill(h, l, {
            color: bar.Close > bar.Open ? 'rgba(255, 0, 0, 0.2)' : 'rgba(255, 0, 0, 0.2)'
        })
        c.hline(bar.High)
        c.plotarrow(bar.Close - bar.Open)
        c.plotshape(bar.Low, {
            style: 'diamond'
        })
        c.plotchar(bar.Close, {
            char: 'X'
        })
        c.plotcandle(bar.Open*0.9, bar.High*0.9, bar.Low*0.9, bar.Close*0.9)
        if (bar.Close > bar.Open) {
            // long/short/closelong/closeshort
            c.signal("long", bar.High, 1.5)
        } else if (bar.Close < bar.Open) {
            c.signal("closelong", bar.Low, 1.5)
        }
        c.close()
    })
}
def main():
    # Call the KLineChart function to create a chart control object c
    c = KLineChart({
        "overlay": True
    })

    # Use the spot exchange object test to obtain K-line data. If you use the futures exchange object test, you need to set up the contract first.
    bars = exchange.GetRecords()
    if not bars:
        return

    for bar in bars:
        c.begin(bar)
        c.barcolor('rgba(255, 0, 0, 0.2)' if bar.Close > bar.Open else 'rgba(0, 0, 0, 0.2)')
        if bar.Close > bar.Open:
            c.bgcolor('rgba(0, 255, 0, 0.5)')

        h = c.plot(bar.High, 'high')
        l = c.plot(bar.Low, 'low')

        c.fill(h, l, 'rgba(255, 0, 0, 0.2)' if bar.Close > bar.Open else 'rgba(255, 0, 0, 0.2)')
        c.hline(bar.High)
        c.plotarrow(bar.Close - bar.Open)
        c.plotshape(bar.Low, style = 'diamond')
        c.plotchar(bar.Close, char = 'X')
        c.plotcandle(bar.Open*0.9, bar.High*0.9, bar.Low*0.9, bar.Close*0.9)
        if bar.Close > bar.Open:
            # long/short/closelong/closeshort
            c.signal("long", bar.High, 1.5)
        elif bar.Close < bar.Open:
            c.signal("closelong", bar.Low, 1.5)

        c.close()
// Not supported currently
If there must be a chart control object for drawing in the custom drawing area of the strategy, use the function KLineChart to create this object. The parameter of the KLineChart function is a chart configuration structure, the chart structure used in the reference code is very simple {overlay: true}). This chart configuration structure only sets the drawing content to be output on the main chart. If overlay is set to false, the content on the chart is output on the sub-chart. If you need to specify a drawing function to draw on the main chart, you can also specify the parameter overlay as true in the specific function call.
The drawing operation is executed by traversing over the K-line data. The drawing operation must start with a c.begin(bar) function call and end with a c.close() function call. The drawing interface functions of the Pine language supported in the drawing operation are:
-
barcolor: Set K-line color
barcolor(color, offset, editable, show_last, title, display)
c.barcolor(bar.Close > bar.Open ? 'rgba(255, 0, 0, 0.2)' : 'rgba(0, 0, 0, 0.2)') // Use the example illustrated in the reference code in this example, without giving unnecessary detailsc.barcolor('rgba(255, 0, 0, 0.2)' if bar.Close > bar.Open else 'rgba(0, 0, 0, 0.2)')displayoptional parameters: “none”, “all”
-
bgcolor: Fill the background of the K-line with the specified color
bgcolor(color, offset, editable, show_last, title, display, overlay)
c.bgcolor('rgba(0, 255, 0, 0.5)')c.bgcolor('rgba(0, 255, 0, 0.5)')displayOptional parameters: “none”, “all”
-
plot: Plot a series of data on the chart
plot(series, title, color, linewidth, style, trackprice, histbase, offset, join, editable, show_last, display)
c.plot(bar.High, 'high')h = c.plot(bar.High, 'high')styleoptional parameters: “stepline_diamond”, “stepline”, “cross”, “areabr”, “area”, “circles”, “columns”, “histogram”, “linebr”, “line”displayoptional parameters: “none”, “all”
-
fill: Fill the background between two drawings or hlines with the provided color
fill(hline1, hline2, color, title, editable, fillgaps, display)
let h = c.plot(bar.High, 'high')
let l = c.plot(bar.Low, 'low')

c.fill(h, l, {color: bar.Close > bar.Open ? 'rgba(255, 0, 0, 0.2)' : 'rgba(255, 0, 0, 0.2)'})
h = c.plot(bar.High, 'high') l = c.plot(bar.Low, 'low') c.fill(h, l, {"color": 'rgba(255, 0, 0, 0.2)' if bar.Close > bar.Open else 'rgba(255, 0, 0, 0.2)'})displayoptional parameters: “none”, “all”
Since the
JavaScriptlanguage cannot specify the incoming parameters according to the names of function formal parameters, in order to solve this problem, a{key: value}structure can be used to specify the parameter passed in a certain formal parameter name, for example, in the reference code, use{color: bar.Close > bar.Open ? 'rgba(255, 0, 0, 0.2)' : 'rgba(255, 0, 0, 0.2)'}to specify thecolorparameter of thefillfunction. If you need to specify parameters with multiple parameter names consecutively, you can use{key1: value1, key2: value2, key3: value3}. For example, in this example, add a parameter specifying atitle:{color: bar.Close > bar.Open ? 'rgba(255, 0, 0, 0.2)' : 'rgba(255, 0, 0, 0.2)', title: 'fill'}.For the color value, you can use the
'rgba(255, 0, 0, 0.2)'method to set, or use the'#FF0000'method to set. -
hline: Renders a horizontal line at a given fixed price level
hline(price, title, color, linestyle, linewidth, editable, display)
c.hline(bar.High)c.hline(bar.High)linestyleoptional parameters: “dashed”, “dotted”, “solid”displayoptional parameters: “none”, “all”
-
plotarrow: Draw up and down arrows on the chart
plotarrow(series, title, colorup, colordown, offset, minheight, maxheight, editable, show_last, display)
c.plotarrow(bar.Close - bar.Open)c.plotarrow(bar.Close - bar.Open)displayoptional parameters: “none”, “all”
-
plotshape: Draw visual shapes on the chart
plotshape(series, title, style, location, color, offset, text, textcolor, editable, size, show_last, display)
c.plotshape(bar.Low, {style: 'diamond'})c.plotshape(bar.Low, style = 'diamond')-
styleoptional parameters: “diamond”, “square”, “label_down”, “label_up”, “arrow_down”, “arrow_up”, “circle”, “flag”, “triangle_down”, “triangle_up”, “cross”, “xcross” -
locationoptional parameters: “abovebar”, “belowbar”, “top”, “bottom”, “absolute” -
sizeoptional parameters: “10px”, “14px”, “20px”, “40px”, “80px”, compared with thesize.tiny,size.small,size.normal,size.large,size.hugein Pine languagesize.autoissize.small. -
displayoptional parameters: “none”, “all”
-
-
plotchar: Draw visible shapes on the chart by using any given Unicode character
plotchar(series, title, char, location, color, offset, text, textcolor, editable, size, show_last, display)
c.plotchar(bar.Close, {char: 'X'})c.plotchar(bar.Close, char = 'X')-
locationoptional parameters: “abovebar”, “belowbar”, “top”, “bottom”, “absolute” -
sizeoptional parameters: “10px”, “14px”, “20px”, “40px”, “80px”, compared with thesize.tiny,size.small,size.normal,size.large,size.hugein Pine languagesize.autoissize.small. -
displayoptional parameters: “none”, “all”
-
-
plotcandle: Draw a K-line chart on the chart
plotcandle(open, high, low, close, title, color, wickcolor, editable, show_last, bordercolor, display)
c.plotcandle(bar.Open*0.9, bar.High*0.9, bar.Low*0.9, bar.Close*0.9)c.plotcandle(bar.Open*0.9, bar.High*0.9, bar.Low*0.9, bar.Close*0.9)displayOptional parameters: “none”, “all”
-
signal: Functions that are not available in the Pine language are used here to draw buying and selling signals
signal(direction, price, qty, id)
c.signal("long", bar.High, 1.5)c.signal("long", bar.High, 1.5)The input parameter
"long"indicates the transaction direction, optional"long","closelong","short","closeshort". The incoming parameterbar.Highis the Y-axis position of the marker signal. The input parameter1.5represents the number of trades of the signal. The fourth parameter can be passed in to replace the text content drawn by default. The default text of the drawn signal marker is the trading direction, for example:"closelong".
For some color, style and other settings used in the above function calls, please refer to Special article on drawing with KLineChart function
LogReset()
LogReset() is used to clear logs. You can pass in an integer parameter to specify the number of recent logs to retain, and clear the rest of the logs. The startup log is counted every time it is started, so if no parameters are passed in, and there is no log output at the start of the strategy, the log will not be displayed at all, waiting for the docker log to return (not an abnormal situation). The function has no return value.
function main() {
    // Mainta