
A quiet fifteen minutes and fifteen minutes of suddenly surging volume each appear as a single fifteen-minute candlestick on a conventional chart. Yet the amount of trading activity within those two periods can be very different.
What happens if we let trading volume determine when a bar closes, then use those bars to identify price breakouts?
This time, we will work through a complete example using a “Volume Clock Breakout” strategy: give the idea to our own AI assistant, have it write the program, read backtest results, inspect runtime logs, and then make changes based on the evidence. Along the way, we need to answer a specific question: does observing the market at a different pace actually improve trading?
In the previous article, we connected this development workflow using the Extended API and a strategy synchronization code. Here, we keep the same framework but switch to FMZ's MCP interface. We will hand tasks to the Agent step by step, working through connection setup, development and testing, and runtime inspections.
1. First, Distinguish Who Writes the Code from Who Executes the Trades
An Agent is an AI assistant that can read and write files, call tools, and work through a sequence of tasks. MCP supplies the platform's tools and parameter descriptions, allowing the Agent to understand how to read strategies, save versions, submit backtests, and query results.
text
Propose a trading idea
↓
The Agent writes the strategy and tests
↓ Via MCP
The platform runs the backtest and returns results and logs
↓
The Agent analyzes the evidence, makes changes, and validates again
After deployment, the strategy program processes market data and calculates signals, while the FMZ Docker runs the program and connects to the exchange. Each trade follows rules written in advance. The Agent handles research, development, and inspection, and can also carry out updates within an explicitly defined scope of operations.
Periodic inspections also require the client or an external scheduler to wake the Agent. MCP supplies the tools; the scheduler initiates inspections at the specified times. The local project stores the source code, experiment configurations, and records.
This is what makes it possible to trace an error log to the version that is running, and to associate a backtest with the rules and parameters used at the time.
In plain language:
The strategy running as a live trading instance on FMZ is the program that does the trading.
The AI Agent handles strategy development, testing, iteration, evaluation, review, and supervision of that instance.
2. Connect Your Own AI and Complete a Read Operation First
Open the FMZ homepage, find “Put FMZ in the hands of your own AI agent,” and click “Copy setup instructions.”
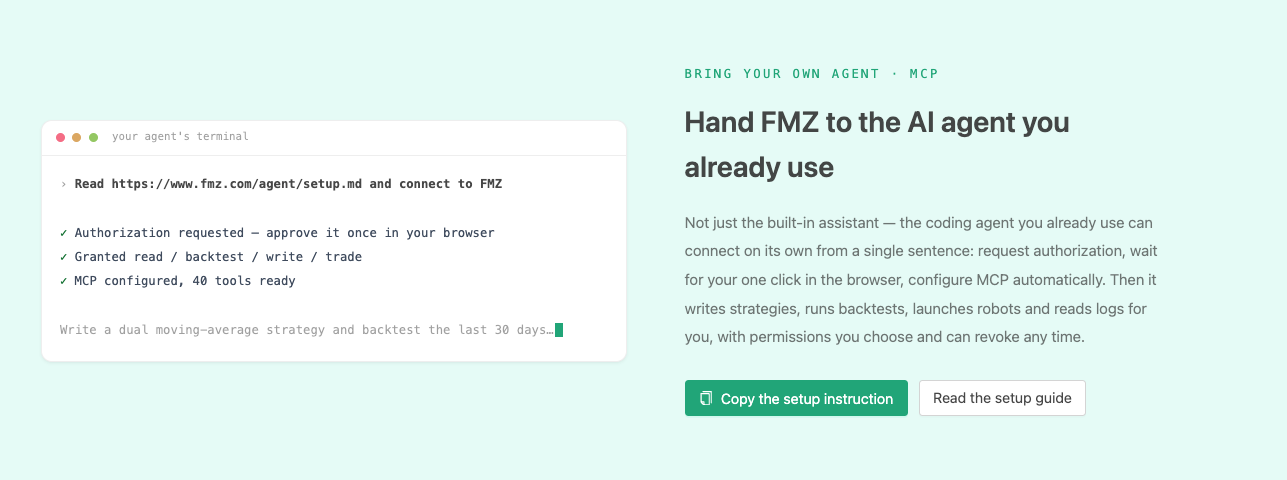
Give the instructions to your assistant and specify the scope for this round:
            text

            Read https://www.fmz.com/agent/setup.md, then connect to FMZ Quant.

Request all permissions for this round.
After connecting, list the available tools, verify the permissions, and complete one read-only query.
Do not create or start any running instances yet.
-
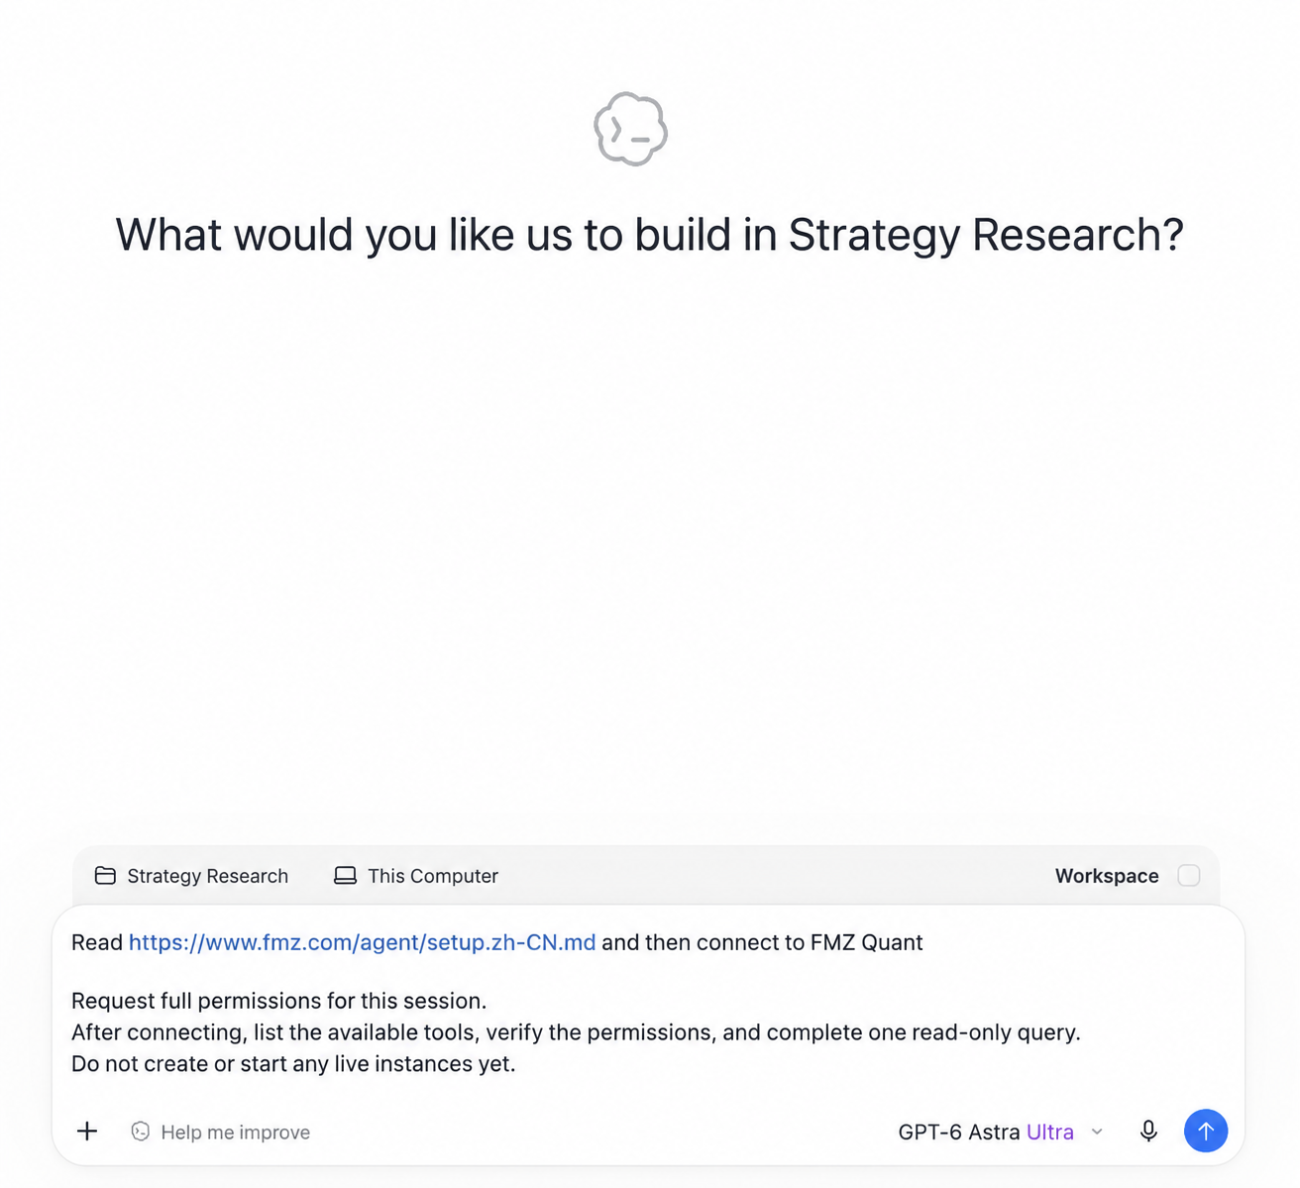
Let the Agent learn how to connect, as shown below:
-
Click the authorization link provided by the Agent:
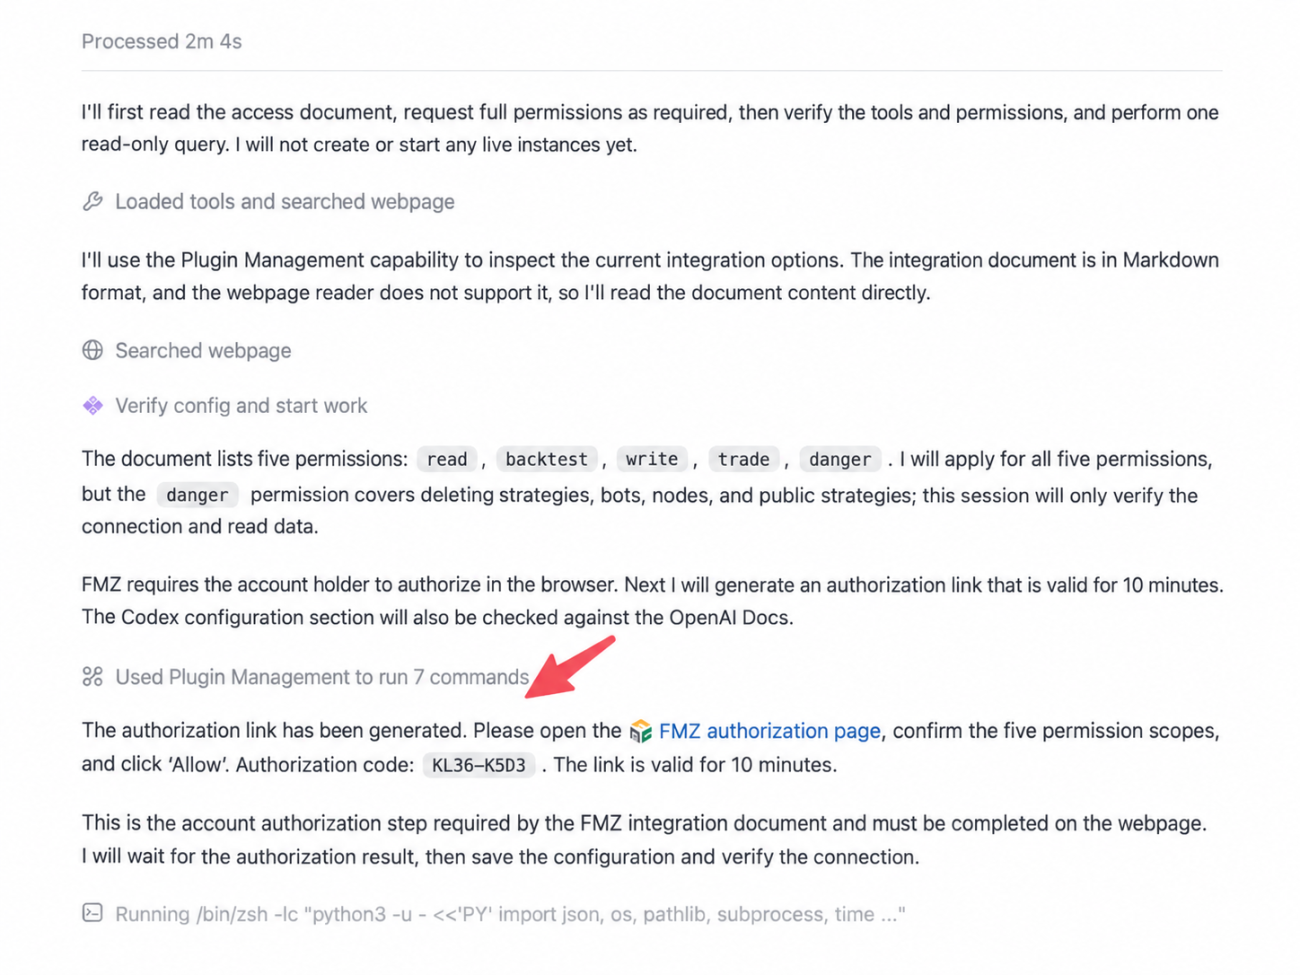
According to the official setup guide, the Agent provides a confirmation link after requesting authorization. You sign in through your browser, review the permissions, and authorize access; the Agent then finishes configuring the connection. If you already have a connection, you can first check whether it works.
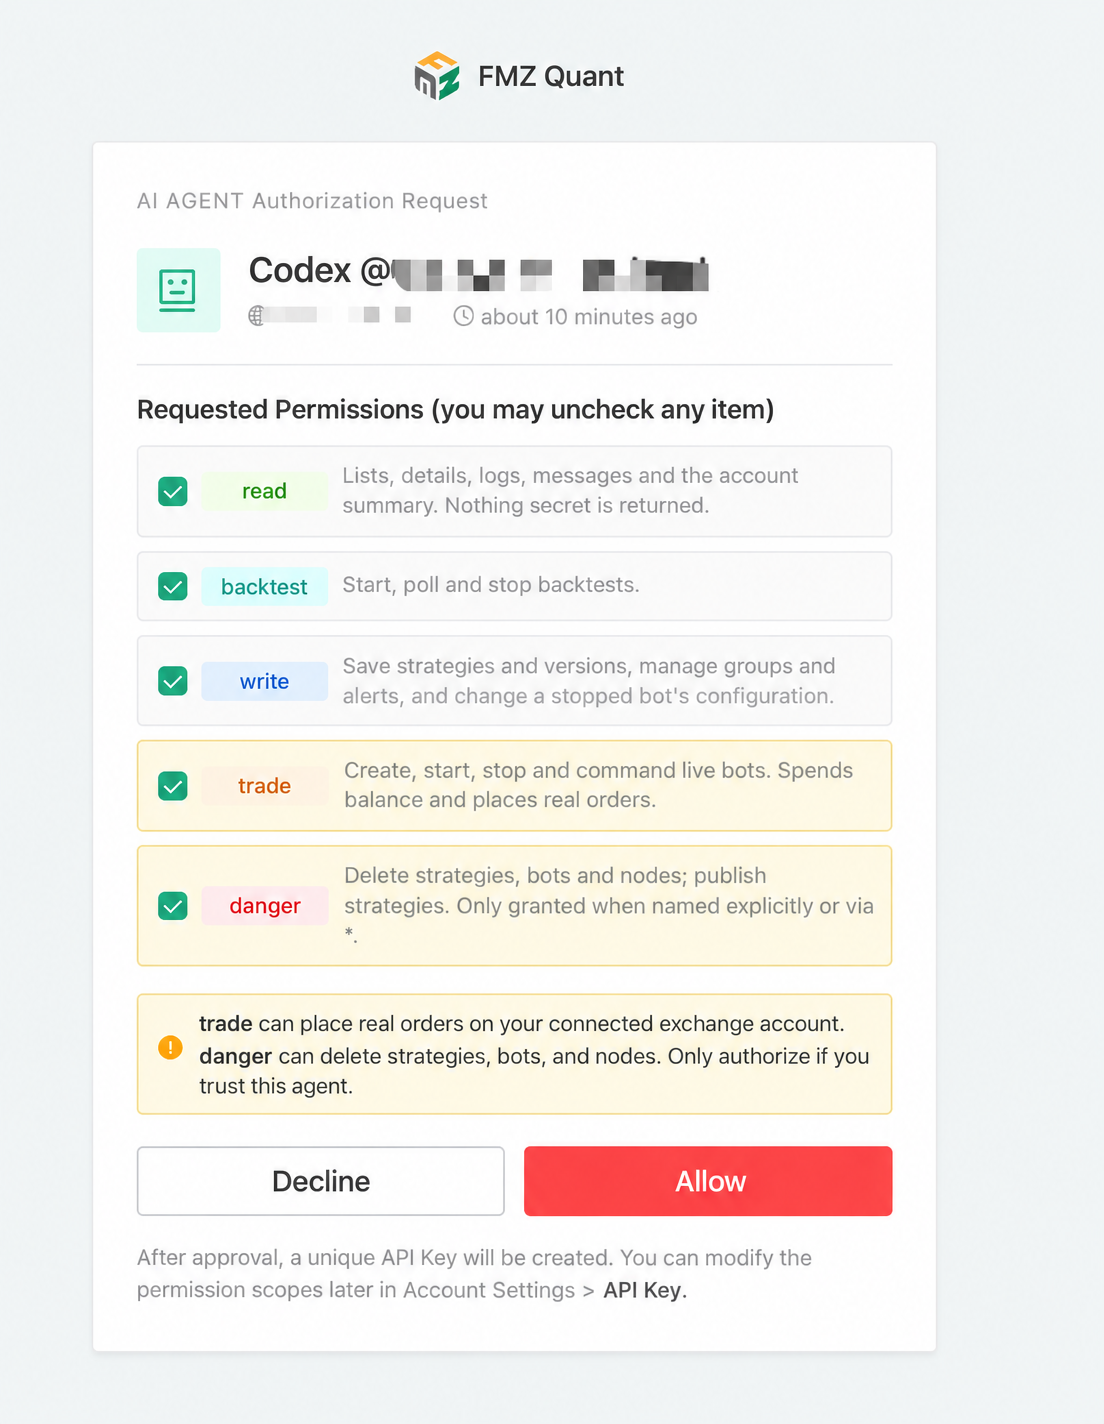
The tool counts shown in the screenshots are illustrative; use the actual tool list returned after connecting. A successful connection is established by tools returning data successfully, not merely by the assistant saying “Setup is complete.”
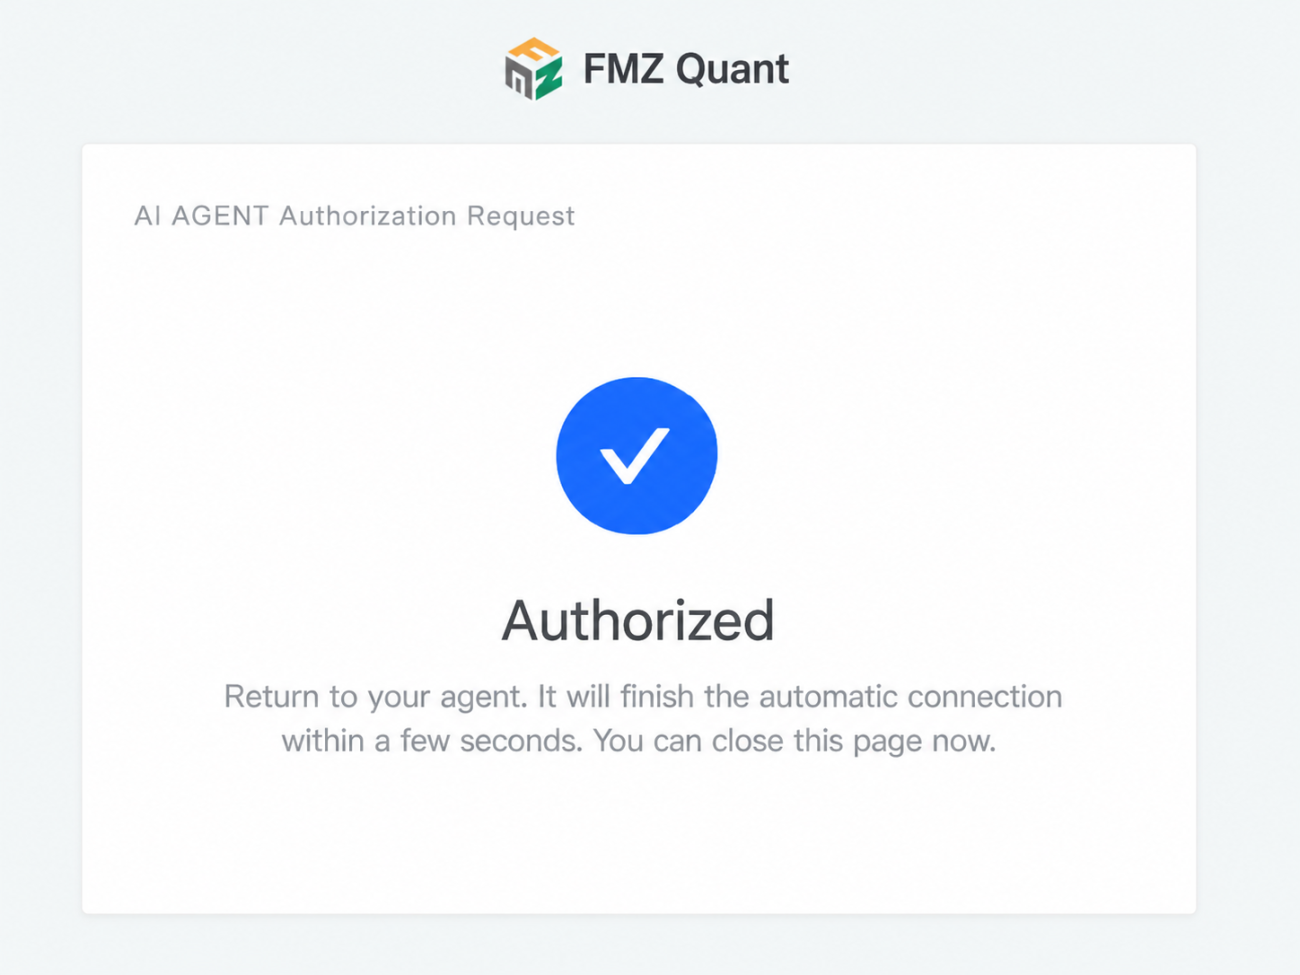
The read, backtest, and write permissions cover reading, backtesting, and saving changes, respectively. Creating, starting, or stopping instances later requires trade permission, along with explicit identification of the instance, Docker, and exchange object. Exchange API keys are configured on the platform's website; the Agent uses the IDs of objects that have already been configured. Permissions can be adjusted on the API Key management page.
For this round, create a separate strategy. During connection setup, save a record of one successful query and the available tool scope. All subsequent development will use the same strategy ID.
3. Turn the Volume Clock into a Reproducible Experiment
First, Explain Why the Idea Is Worth Testing
A conventional fifteen-minute bar closes when its time is up. A volume bar accumulates trading volume and closes when it reaches a target.
Suppose a bar has a target of 1,000 volume units: at 50 units traded per minute, it takes twenty minutes to complete; at 250 units per minute, it takes four minutes. This simply illustrates the mechanism. The actual target is calculated from historical data.
Our hypothesis is that updating the observation interval more quickly when trading activity is concentrated may help identify breakouts sooner. We also need to consider the opposite possibility: the price may already have moved a long way by the time volume surges, faster bar formation may produce more false breakouts, and any additional returns may fall short of covering the costs.
To evaluate this, the first version uses simple, fixed breakout rules and is compared against a version using conventional fifteen-minute bars.
Define the Rules for the First Version
The strategy is called “Volume Clock Breakout,” or VCB for short. The initial study uses ETH_USDT.swap and completed one-minute market data bars.
Before each new volume bar begins, take the volume from the preceding full twenty-four hours and divide it by 96 to set the target volume for that bar. The number 96 is the number of fifteen-minute intervals in a day. It calibrates the initial scale; it does not mean that exactly 96 bars will form each day.
The target stays fixed throughout the bar. Aggregate open, high, low, close, and volume minute by minute, completing a bar the first time the target is reached. Even a minute with extremely high volume produces only one bar. Do not invent an intraminute sequence of prices or reuse excess volume.
This method is called “one-minute approximate volume bars.” Volume units must be consistent: coin quantities, contract counts, and traded notional amounts must not be mixed.
The trading rules are fixed as follows:
| Item | Initial setting |
|---|---|
| Entry | Go long when the completed bar closes above the highest high of the preceding twenty bars; go short when it closes below the lowest low of the preceding twenty bars |
| Volatility measure | Fourteen-bar ATR with Wilder smoothing, using completed bars only |
| Exit | Initial stop at 2 ATR, target at 3 ATR, and a maximum holding time of 240 minutes |
| Position size | Calculate from the stop distance and risk budget, then apply notional, margin, and quantity constraints |
| Repeated trading | Process each bar only once; do not add to an existing position or reverse it immediately |
Estimate the order quantity as “account equity × risk fraction ÷ (stop price distance + estimated trading cost per unit).” Then apply the maximum notional limit and round down to the quantity step size. If the quantity or margin is insufficient, display the reason rather than increasing the budget automatically.
Fix the ATR when the signal is confirmed, set the stop and target from the actual average fill price, and measure the maximum holding time from the first fill. Before trading begins, the twenty-four-hour volume baseline, twenty historical bars, and the data required for ATR must all be ready. Wait if the warm-up is incomplete.
The channel must exclude the current bar. The core sequence is shown below; a complete program also needs data, order, and risk handling:
            javascript

            let signal = 0;
const prior = completedBars.slice(-20);

if (prior.length === 20) {
    const upper = Math.max(...prior.map(b => b.High));
    const lower = Math.min(...prior.map(b => b.Low));
    signal = closedBar.Close > upper ? 1
           : closedBar.Close < lower ? -1 : 0;
}

completedBars.push(closedBar);
Read the historical channel first, then add the current bar. If the current bar is included in the highest-high calculation, a strict upward breakout cannot occur.
After confirming a signal, execute using the next available market data. Do not assume a fill at a closing price that has already passed. Checks for a position's stop, profit target, and holding-time limit run independently, without waiting for the next volume bar to complete.
Step One: Give the Requirements to the Agent
Send this article to the Agent as the requirements specification, followed by these development instructions:
            text

            Create a new VCB strategy in FMZ JavaScript, supporting ETH_USDT.swap.
Implement the volume-bar version according to this article's rules, and provide a fifteen-minute time-bar version for comparison.
Both versions must share the signal, position-sizing, and exit code. Use the backtest configuration below for the initial parameters.

Check the market data interval, volume units, warm-up length, and trading quantity rules.
Process duplicate minutes only once; do not open new positions while a data gap remains unresolved.
After a restart, restore data, order, and position state; do not place catch-up orders for past signals.
If an order's submission result is uncertain, query the order first rather than submitting it again immediately.

Show the breakout channel on the chart. In the status panel, show bar-formation progress, reasons for not trading,
orders and positions, account equity, and the strategy's net profit.

Complete local tests first, and deliver the source code, parameter descriptions, test results, and usage instructions.
After saving to the platform, read the strategy back to verify it, and record the strategy ID and code version.
Do not start a running instance yet.
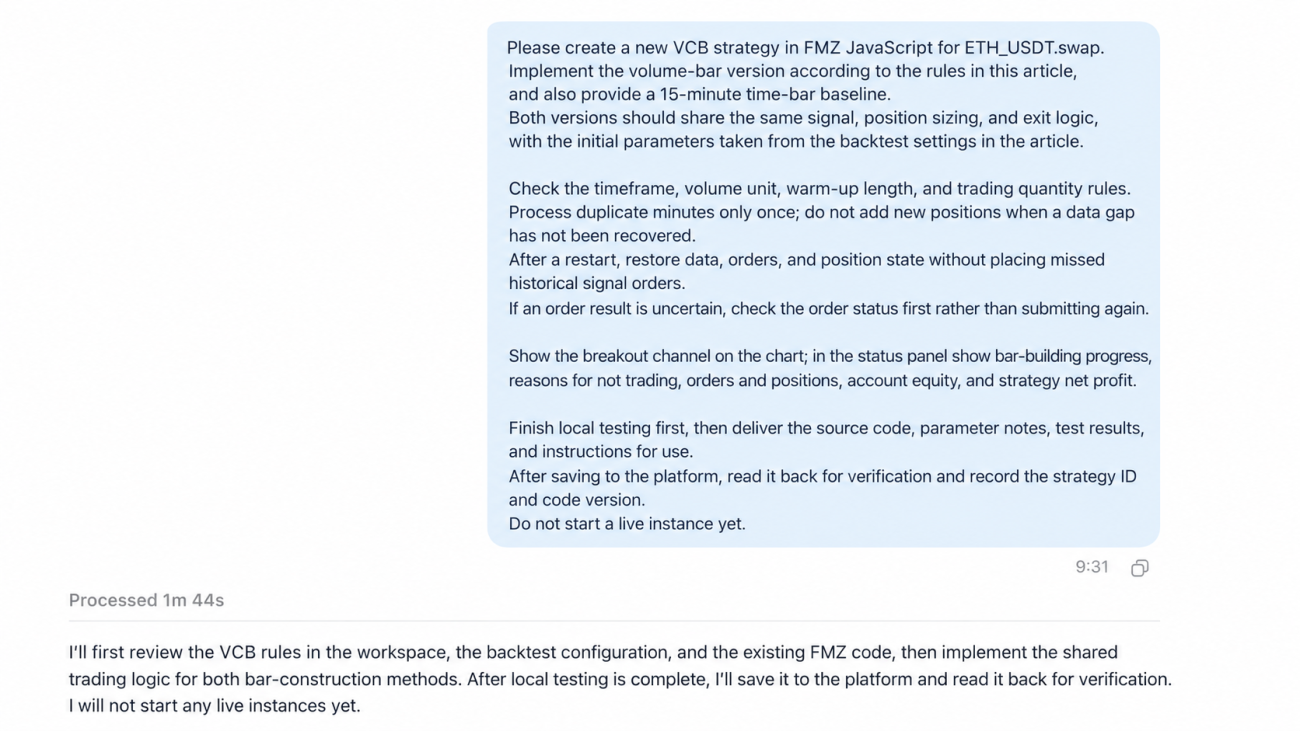
For specific API calls, see the GetRecords documentation. The strategy rules and test conditions are provided in this article; the API documentation explains how to make the calls.
Local tests should focus on three questions: does the same market data produce the same bars; can the program resume from its previous state after a restart; and can subsequent data rewrite earlier signals? While checking the conditions for opening new positions, continue handling exits for existing positions.
Partial fills, duplicate reports, and order submission timeouts need separate local tests. FMZ backtesting uses taker execution with full fills, so it cannot cover partial fills. A simulated intraminute price path does not represent the actual sequence of prices either. See the backtest mode explanation.
-
The Agent has designed the strategy on its own from the requirements:
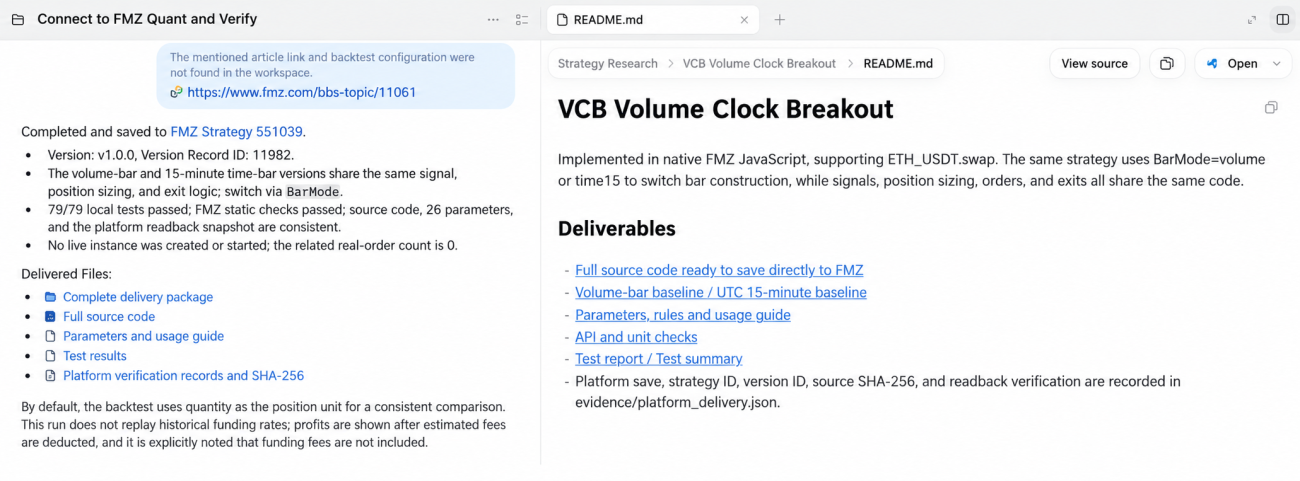
Step Two: Check the Program First, Then Compare the Strategies
First, select one week within the development period for a short backtest, and verify the warm-up, bar formation, signals, orders, and profit ledger. If there are no trades, inspect the counts at each stage and use deterministic samples to verify that signals can trigger. Do not relax the actual trading rules just to produce trades.
Once the program's flow is working correctly, run the formal comparison. The following fixed configuration is suggested for the first round. All settings are research conditions:
- Historical period: 2025-10-01 to 2026-10-01, treated as a UTC interval that includes the start and excludes the end.
- Use the first nine months for development; reserve the three months starting on 2026-07-01 for the final check.
- Both versions start with 10,000 USDT in simulated capital, a planned risk fraction of 0.25% per trade, and a maximum notional amount of 1,000 USDT.
- Initially assume, per side, a taker fee of 5 bp and slippage of 2 bp, then add a stress test with both doubled. These are research assumptions; verify the actual fee rates separately.
- Obtain additional warm-up data from before the start date. If the full history is unavailable, report the available coverage first, then establish a new fixed experiment period.
One basis point (1 bp) is one ten-thousandth. Calculate funding fees based on historical positions. If the data is missing, label the results “excluding funding fees”; do not record a missing cost as zero.
Both versions start from the same one-minute data, with time bars aggregated on UTC fifteen-minute boundaries. The only deliberately changed experimental condition is the bar construction method; position sizing and exits share the same implementation. Actual ATR values, position sizes, holding times, and trading frequency may change as a result, and the report should list these as well.
            text

            Run both versions using the fixed configuration and record each backtest ID.
Complete the development-period tests and cost stress tests first. Freeze the code and parameters before checking the holdout period.

Compare signal counts, actual trade counts, holding times, turnover, gross profit,
trading fees, funding fees, net profit, and maximum drawdown.
List missing data and execution-model assumptions separately. Do not deduct fees already included by the engine a second time.

If the code raises errors, read the logs and fix them, for no more than three rounds. Save each version and retest under the original conditions.
Do not continue tuning parameters based on the holdout results, or automatically select whichever period looks best.
If gross profit rises while net profit falls, examine the costs of the additional trades. If performance improves during development but fails in the holdout period, examine how dependent the results are on market conditions. If the two versions produce unexpectedly identical bars, or the same signal repeatedly submits orders, return to debugging the implementation first.
Successful testing includes correct program behavior and complete records. Whether the strategy has a trading edge is a separate question, judged by its performance after costs.
4. Runtime Inspections: Evidence for Anomalies and Verification for Updates
Observe First, Then Verify Orders and Profit
After historical testing, start in observation-only mode to confirm that real-time data, bar formation, and signals work correctly. Then use an explicitly designated simulated-trading exchange object to verify order submission and reconciliation.
The platform interface uses “live trading instance” as the name for the runtime container. Whether it uses real or simulated funds depends on the connected exchange object. Creating an instance may incur platform fees. The strategy's “Allow order submission” switch does not turn a real exchange into a simulated one either.
Before starting, fill in the objects and budget in the following task:
            text

            Use my designated Docker and simulated-trading exchange object to start the verified VCB version.
First report the object IDs, trading environment, parameters, and the results of the funds and order-quantity checks.
Operate within the scope explicitly defined for this round; do not modify other instances.

After starting, read back the version, data status, orders, positions, and net profit.
Record order submission, exchange acknowledgment, actual fills, and cancellation acknowledgment. Do not treat a request as a fill.
Keep five categories of information in the status panel: data warm-up, volume progress, signals and blocking reasons, orders and positions, and equity and strategy profit. Keep detailed data in the logs.
If there are no trades, trace the issue along this path:
            text

            One-minute data → Completed bars → Breakout signals → Execution checks → Order submission → Fills
If no new bar has formed, the strategy may be waiting for volume. If a bar has formed without a breakout, no signal has appeared. If there is a signal but no order, check quantity, margin, quotes, and orders awaiting confirmation. Count these reasons separately rather than combining them into a single “Conditions not met” message.
Account separately for realized profit, unrealized profit, trading fees, and funding fees. Exclude deposits, withdrawals, and profit or loss from other strategies. The status panel can refresh unrealized profit and loss; record profit logs when events occur, such as fills, position changes, or funding-fee entries.
Simulated trading first verifies system behavior. A day without a fill does not establish whether a strategy is effective, and a handful of fills does not demonstrate long-term profitability.
Make Inspections into Tasks That Actually Run
First, manually perform one read-only inspection to confirm that status information and new logs can be retrieved, then set up a schedule:
            text

            Inspect the designated instance every day at 9:00 a.m. Asia/Singapore time.
Verify the running version, parameters, Docker, exchange object, and data status.
Read new records from the previous log cursor, and report counts at each stage,
reasons for not trading, orders and positions, fees, and net profit.

Save the time, evidence, and conclusions to the local project.
This inspection is read-only. Do not automatically change parameters, modify code, or restart the instance.
Return the schedule record after creating it, and retain a record of an actual run after it executes.
If your current assistant does not support scheduling, use an external scheduled task to wake it. Having MCP connected and having a scheduled inspection actually run are two separate things that each need verification.
Work Through the Update Process with One Reproducible Problem
When an anomaly appears during testing, give the Agent both the raw data and the logs:
            text

            Reproduce the problem from this inspection record, and identify the code version associated with the evidence.
Fix only the identified issue, add regression tests, and retest using the original configuration.
Report the changes, test results, and any matters that remain unverified.

If the running instance needs updating, first verify how outstanding orders and positions will be handled.
Then save the version, update, and restart within the scope explicitly defined for this round.
After restarting, read back the startup logs, actual running version, orders and positions, and profit ledger.
If no fault has been found yet, you can deliberately test duplicate minutes, missing minutes, or a restart during a local replay to check whether the program handles them as designed.
After successfully saving the new source code, you still need to confirm that the running instance is actually using the new version. Retain a code digest, backtest IDs, runtime parameters, logs, and a research conclusion that can be checked, so the next round can build on the existing results.
-
The live trading instance started and supervised by the Agent, with no human intervention, is shown below:
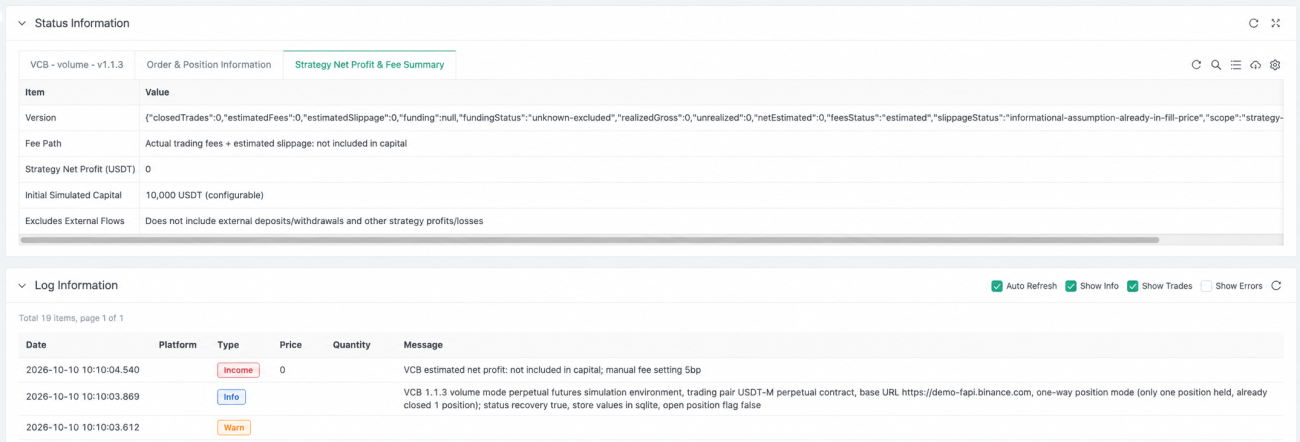
The Strategy Used in This Study
The source code for the strategy researched autonomously by AI through this complete loop is publicly available: https://www.fmz.com/strategy/551039
- 1