
Summary
The price is either up or down. In the long run, the probability of price rise and fall should be 50%, so to correctly predict the future price, you need to obtain all the factors that affect the price in real time, and then give each factor a correct weight, and finally make Objective and rational analysis. To list all the factors that affect the price, it may fill the entire universe.
Summarized as: global economic environment, national macro policies, related industrial policies, supply and demand relations, international events, interest rates and exchange rates, inflation and deflation, market psychology, and other unknown factors, etc. Prediction has become a huge and impossible task. So early on, I understood that the market is unpredictable. Then all predictions in the market have become hypotheses, and trading has become a game of probability, which is interesting.
Why use capital flow
Since the market is unpredictable, is it really indifferent? No, all macro and micro factors have been reflected in the price, which means that the price is the result of the interaction of all factors. We only need to analyze the price to make a complete trading strategy.
Think about it first, why does the price increase?
You might say, because: the country supports relevant industrial policies, the country of origin is torrential rain, the international trade war, the MACD golden fork is bought, others have bought it, etc. Of course, these may not be wrong. With hindsight, we can always find out the reasons for the price increase.
In fact, the rise and fall of prices are similar to rising tides. The price increase is inseparable from the promotion of funds. in the market, if there are more buyers than sellers, the price will rise. Conversely, if there are more sellers than buyers, the price will fall. With this concept, we can give reasonable expectations for future price trends based on the supply and demand relationship reflected in the net flow of funds.
Fund flow principle
Different from traditional analysis, the fund flow analysis analyzes which transactions are the active inflow of funds and which transactions are the active outflow of funds based on the transaction data over a period of time. Then, by subtracting the active outflow volume from the active inflow volume during this period, we can know the net inflow of funds during this period. If the net inflow of funds is positive, it means that the supply of this product is in short supply; if the net outflow of funds means that the supply of this product is oversupply.
After reading this, some people may wonder that in actual transactions, a deal will only be made when someone buys and someone sells. The transaction order must have as much selling volume as there is buying volume, and the funds must be in and out of the same amount. Where does the inflow and outflow of capital come from? In fact, strictly speaking, every buy order must correspond to a corresponding sell order, and the capital inflow and capital outflow must be equal. If we want to calculate which orders are actively bought and which orders are actively sold, we can only use a compromise method, using K line bar data, based on transaction volume and price.
Fund flow calculation method
The change in the flow of funds accurately corresponds to real-time market behavior, and the net flow of funds is calculated in real time by integrating k line bar data. There are two algorithms for calculating the active flow of funds:
First, if the current transaction price of the current order is executed at the counterparty price or at an overprice, the buying transaction price >= the selling transaction price, which means that the buyer is more willing to complete the transaction at a higher price, which is included in the active inflow of funds.
Second, if the current transaction price > the last transaction price, then it can be understood that the current transaction volume actively pushes up the price increase, which is included in the active inflow of funds.
Take the above second algorithm as an example:
The closing price of a certain product at 10:00 is 3450, and the closing price at 11:00 is 3455, so we will include the transaction volume between 10:00 and 11:00 as the active capital inflow. Otherwise, it is included in the initiative outflow of funds. This article is based on the second method, adding the factor of price volatility. By comparing the k line bar closing price before and after, the volume of the rising or falling k line bar * volatility is included in a sequence, and then further according to the sequence Calculate the active inflow ratio of funds.
Trading logic
This article describes the flow of funds in the futures market from the perspective of "volume", and establishes a trading model for judging short-term price trends through real-time analysis of K line bar data. Under normal circumstances, capital flow and price trends can be divided into four basic conditions:
The price rises and the active net inflow of funds per unit time: this situation is strong, and the future price will continue to rise more likely;
The stock price rises, and the active net outflow of funds per unit time: In this case, it is a medium-strong position, and the rate of future price increases will be greatly reduced;
The stock price falls, while the active net inflow of funds per unit time: this is a weak situation, and the future price continues to fall more likely;
The stock price falls, and at the same time the active net outflow of funds per unit time: in this case, it is a moderately weak position, and the rate of future price declines will be greatly reduced;
The main variables are as follows:
Previous low (ll)
Previous high (hh)
Active buying (barIn)
Active selling (barOut)
The ratio of active inflow of funds to active outflow of funds (barRatio)
Opening position threshold (openValve)
Current holding position (myAmount)
Last K-line closing price (close)
Entry and exit conditions
A good quantitative trading strategy requires not only stable returns, but also the ability to control risks and avoid large losses when there is a small probability. Here we use the strategy of tracking the flow of active funds, with the help of short-term price forecasts to analyze the direction of commodity futures, so as to achieve high-profit and low-risk effects.
-
Long position opening: if there is no current holding position, and barRatio > openValve, open the long position;
-
Short position opening: if there is no current holding position and barRatio < 1 / openValve, open the short position;
-
Long position closing: If the current long position is held and close < ll, sell and close the long position;
-
Short position closing: If the current short position is held and close > hh, buy and close the short position;
Writing strategy source code
Obtain and calculate data
function data() {
var self = {};
var barVol = [];
var bars = _C(exchange.GetRecords); //Get K line bar data
if (bars.length < len * 2) { //Control the length of the K line bar data array
return;
}
for (var i = len; i > 0; i--) {
var barSub_1 = bars[bars.length - (i + 1)].Close - bars[bars.length - (i + 2)].Close; //Calculate the difference between the current closing price and the previous K line bar closing price
if (barSub_1 > 0) { //If the price rises, add a positive number to the array
barVol.push(bars[bars.length - (i + 1)].Volume * (bars[bars.length - (i + 1)].High - bars[bars.length - (i + 1)].Low));
} else if (barSub_1 < 0) { //If the price drops, add a negative number to the array
barVol.push(-bars[bars.length - (i + 1)].Volume * (bars[bars.length - (i + 1)].High - bars[bars.length - (i + 1)].Low));
}
}
if (barVol.length > len) {
barVol.shift(); //Free up excess data
}
self.barIn = 0;
self.barOut = 0;
for (var v = 0; v < barVol.length; v++) {
if (barVol[v] > 0) {
self.barIn += barVol[v]; //Consolidate all active inflows funds
} else {
self.barOut -= barVol[v]; //Consolidate all active outflow funds
}
}
self.barRatio = self.barIn / Math.abs(self.barOut); //Calculate the ratio of active inflows to active outflows
bars.pop(); //Delete unfinished K line bar data
self.close = bars[bars.length - 1].Close; //Get the closing price of the pervious bar
self.hh = TA.Highest(bars, hgLen, 'High'); //Get the previous high price
self.ll = TA.Lowest(bars, hgLen, 'Low'); //Get the previous low price
return self;
}
Obtain K line bar data directly through the GetRecords method in the FMZ API. Contains the highest price, lowest price, opening price, closing price, volume, and standard timestamp. If the latest transaction price is greater than the last transaction price, then the latest transaction volume * (highest price-lowest price) is included in the active buying; if the latest transaction price is less than the last transaction price, then the latest volume * (highest price-lowest price) is included in active selling;
Get position data
            function positions(name) {
    var self = {};
    var mp = _C(exchange.GetPosition); //Get positions
    if (mp.length == 0) {
        self.amount = 0;
    }
    for (var i = 0; i < mp.length; i++) { //Position data processing
        if (mp[i].ContractType == name) {
            if (mp[i].Type == PD_LONG || mp[i].Type == PD_LONG_YD) {
                self.amount = mp[i].Amount;
            } else if (mp[i].Type == PD_SHORT || mp[i].Type == PD_SHORT_YD) {
                self.amount = -mp[i].Amount;
            }
            self.profit = mp[i].Profit;
        } else {
            self.amount = 0;
        }
    }
    return self;
}
Get the basic position data through the GetPosition method in the FMZ platform API, and further process the basic data. If the current long position is held, then the positive position quantity is returned; if the current position is short, then the negative position quantity is returned. The purpose of this is to facilitate the calculation of the logic of opening and closing positions.
Placing orders
            function trade() {
    var myData = data(); //Execute data function
    if (!myData) {
        return;
    }
    var mp = positions(contractType); //Get position information
    var myAmount = mp.amount; //Get the number of positions
    var myProfit = mp.profit; //Get floating profit and loss
    if (myAmount > 0 && myData.close < myData.ll) {
        p.Cover(contractType, unit); //close long position
    }
    if (myAmount < 0 && myData.close > myData.hh) {
        p.Cover(contractType, unit); //close short position
    }
    if (myAmount == 0) {
        if (myData.barRatio > openValve) {
            p.OpenLong(contractType, unit); //open long position
        } else if (myData.barRatio < 1 / openValve) {
            p.OpenShort(contractType, unit); //open short position
        }
    }
}
Strategic characteristics
- Features:
Few core parameters: The model has a clear design idea, with only three core parameters. The optimization space is small, and overfitting can be effectively avoided.
Strong universality: The strategy is simple in logic and has high universality. It can adapt to most varieties except agricultural products and can be combined with multiple varieties.
- Improvements:
Adding holding position conditions: one-way (stock) market flow of funds can define the inflow or outflow of funds based on factors such as price fluctuations and trading volume. However, because the strategy does not include the condition of holding position, the statistical active capital flow may be distorted.
Adding the standard deviation condition: only relying on the flow of funds as the condition for opening a position, there may be frequent false signals, resulting in frequent opening and closing of positions. Filter false signals by counting the average value of the net outflow of funds within a specified time and adding the standard deviation up and down.
Complete strategy source code:
            /*backtest
start: 2016-01-01 09:00:00
end: 2019-12-31 15:00:00
period: 1h
exchanges: [{"eid":"Futures_CTP","currency":"FUTURES"}]
*/

var p = $.NewPositionManager(); //Call commodity futures trading library

//Holding Position data processing
function positions(name) {
    var self = {};
    var mp = _C(exchange.GetPosition); //Get positions
    if (mp.length == 0) {
        self.amount = 0;
    }
    for (var i = 0; i < mp.length; i++) { //Holding Position data processing
        if (mp[i].ContractType == name) {
            if (mp[i].Type == PD_LONG || mp[i].Type == PD_LONG_YD) {
                self.amount = mp[i].Amount;
            } else if (mp[i].Type == PD_SHORT || mp[i].Type == PD_SHORT_YD) {
                self.amount = -mp[i].Amount;
            }
            self.profit = mp[i].Profit;
        } else {
            self.amount = 0;
        }
    }
    return self;
}

//Market data processing function
function data() {
    var self = {};
    var barVol = [];
    var bars = _C(exchange.GetRecords); //Get K line bar data
    if (bars.length < len * 2) { //Control the length of the K line bar data array
        return;
    }
    for (var i = len; i > 0; i--) {
        var barSub_1 = bars[bars.length - (i + 1)].Close - bars[bars.length - (i + 2)].Close; //Calculate the difference between the current closing price and the previous K line bar closing price
        if (barSub_1 > 0) { //If the price rises, add a positive number to the array
            barVol.push(bars[bars.length - (i + 1)].Volume * (bars[bars.length - (i + 1)].High - bars[bars.length - (i + 1)].Low));
        } else if (barSub_1 < 0) { //If the price drops, add a negative number to the array
            barVol.push(-bars[bars.length - (i + 1)].Volume * (bars[bars.length - (i + 1)].High - bars[bars.length - (i + 1)].Low));
        }
    }
    if (barVol.length > len) {
        barVol.shift(); //Free up excess data
    }
    self.barIn = 0;
    self.barOut = 0;
    for (var v = 0; v < barVol.length; v++) {
        if (barVol[v] > 0) {
            self.barIn += barVol[v]; //Consolidate all active inflows funds
        } else {
            self.barOut -= barVol[v]; //Consolidate all active outflow funds
        }
    }
    self.barRatio = self.barIn / Math.abs(self.barOut); //Calculate the ratio of active inflows to active outflows
    bars.pop(); //Delete unfinished K line bar data
    self.close = bars[bars.length - 1].Close; //Get the closing price of the last K line bar
    self.hh = TA.Highest(bars, hgLen, 'High'); //Get the previous high price
    self.ll = TA.Lowest(bars, hgLen, 'Low'); //Get the previous low price
    return self;
}

//Trading function
function trade() {
    var myData = data(); //Execute data function
    if (!myData) {
        return;
    }
    var mp = positions(contractType); //Get position information
    var myAmount = mp.amount; //Get the number of positions
    var myProfit = mp.profit; //Get floating profit and loss
    if (myAmount > 0 && myData.close < myData.ll) {
        p.Cover(contractType, unit); //close long position
    }
    if (myAmount < 0 && myData.close > myData.hh) {
        p.Cover(contractType, unit); //close short position
    }
    if (myAmount == 0) {
        if (myData.barRatio > openValve) {
            p.OpenLong(contractType, unit); //open long position
        } else if (myData.barRatio < 1 / openValve) {
            p.OpenShort(contractType, unit); //open short position
        }
    }
}

//The main entrance of the program, start from here
function main() {
    while (true) { //Enter the loop
        if (exchange.IO("status")) { //If it is the market opening time
            _C(exchange.SetContractType, contractType); //Subscription contract
            trade(); //Execute trade function
        }
    }
}
Strategy address:
https://www.fmz.com/strategy/87698
Strategy backtest
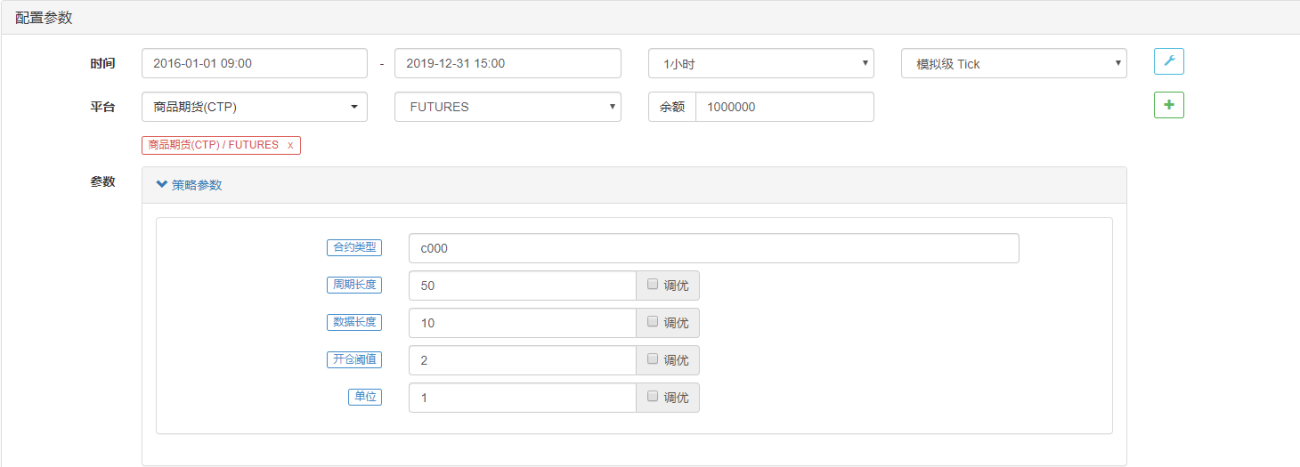
Strategy configuration:
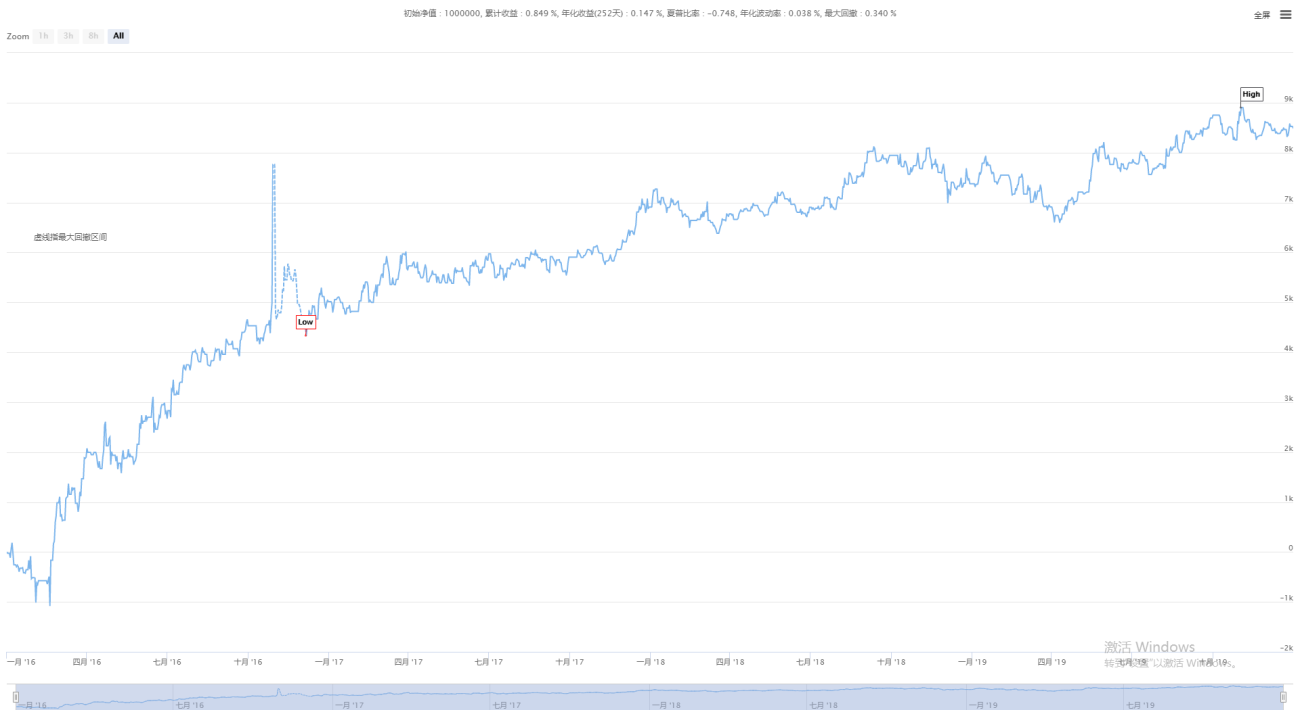
Backtest performance:
To sum up
Through modeling, this article uses the commodity futures K line bar data provided by the FMZ trading platform to establish a net capital flow model through data collection, related analysis, and prediction technology. Use time series analysis to predict future commodity futures prices and design a quantitative trading strategy for commodity futures.
It should be noted that the flow of funds referred to in this article refers to the active flow of funds. It refers to the strength of the seller and the buyer in the market, not the entry or exit of funds. Judging future prices by analyzing the behavior of buyers and sellers in the market has no short-term reference significance.
- 1