শিক্ষানবিস, এটি পরীক্ষা করে দেখুন আপনাকে ক্রিপ্টোকারেন্সি পরিমাণগত ট্রেডিংয়ে নিয়ে যান (5)
লেখক:নিনাবাদাস, তৈরিঃ ২০২২-০৪-১৮ ১৭ঃ২০ঃ৫৩, আপডেটঃ ২০২২-০৪-১৮ ১৭ঃ৩০ঃ২৭শিক্ষানবিস, এটি পরীক্ষা করে দেখুন আপনাকে ক্রিপ্টোকারেন্সি পরিমাণগত ট্রেডিংয়ে নিয়ে যান (5)
পূর্ববর্তী নিবন্ধে, আমরা একটি সহজ গ্রিড কৌশল ট্রেডিং লজিক বিশ্লেষণ ব্যাখ্যা. এই নিবন্ধে, আমরা এই শিক্ষণ কৌশল নকশা সম্পন্ন করতে অবিরত হবে.
-
ট্রেডিং লজিক বিশ্লেষণ যেমনটি আমরা পূর্ববর্তী নিবন্ধে উল্লেখ করেছি, যতক্ষণ আপনি গ্রিডের প্রতিটি গ্রিড লাইন অতিক্রম করেন এবং বর্তমান মূল্য গ্রিড লাইনটি উপরে বা নীচে অতিক্রম করে তা বিচার করেন, তখন ট্রেডিং অ্যাকশনটি ট্রিগার করা যেতে পারে। কিন্তু আসলে, এখনও অনেক যুক্তির বিবরণ রয়েছে এবং কৌশল লেখার বিষয়ে যারা জানেন না তারা প্রায়শই একটি ভুল বোঝাবুঝি তৈরি করে যে
তর্কটি খুব সহজ, কোডটি কেবল কয়েকটি লাইন হওয়া উচিত এবং প্রকৃত লেখায় এখনও অনেকগুলি বিবরণ পাওয়া যায়। আমাদের প্রথম বিষয় বিবেচনা করতে হবে তা হল অসীম গ্রিডের নকশা। মনে রাখবেন গত নিবন্ধে আমরা একটি ফাংশন ডিজাইন করেছি।
createNetএকসাথে প্রাথমিক গ্রিড ডেটা স্ট্রাকচার তৈরি করতে? এই ফাংশনটি একটি সীমিত সংখ্যক গ্রিড লাইন সহ একটি গ্রিড ডেটা স্ট্রাকচার তৈরি করে। সুতরাং যদি, যখন কৌশলটি চলছে, দাম এই গ্রিড ডেটা স্ট্রাকচারের সীমানা অতিক্রম করে (উপরে গ্রিড লাইনের বাইরে যেখানে দাম সর্বোচ্চ, এবং নীচের গ্রিড লাইন যেখানে দাম সর্বনিম্ন)? তাই প্রথমে আমাদের গ্রিড ডাটা স্ট্রাকচারে একটি এক্সটেনশন মেকানিজম যোগ করতে হবে।কৌশল প্রধান ফাংশন লিখতে শুরু করুন, এবং প্রধান ফাংশন কোড যেখানে কৌশল কার্যকর শুরু হয়.
var diff = 50                                 // global variable, the grid interval, can be designed as parameter; for an easy explanation, we write it in an infinite loop
function main() {
    // After the bot starts running, execute the strategy code from here
    var ticker = _C(exchange.GetTicker)       // obtain the latest ticker data in the market; for the ticker data structure, you can refer to FMZ API documentation: https://www.fmz.com/api#ticker
    var net = createNet(ticker.Last, diff)    // the function to initially construct the grid data structure we designed in the previous article; here we construct a grid data structure net

    while (true) {                            // then, the program logic enters the while infinite loop, and the strategy will repeatedly execute the code within the {} symbol from here
        ticker = _C(exchange.GetTicker)       // the first line of the infinite loop code gets the latest market quote data, and updates it to the variable ticker
        // check the grid range
        while (ticker.Last >= net[net.length - 1].price) {
            net.push({
                buy : false,
                sell : false,
                price : net[net.length - 1].price + diff,
            })
        }
        while (ticker.Last <= net[0].price) {
            var price = net[0].price - diff
            if (price <= 0) {
                break
            }
            net.unshift({
                buy : false,
                sell : false,
                price : price,
            })
        }

        // the code is not completed...
    }
}
এটি এমন কোড যা গ্রিড ডেটা স্ট্রাকচারকে সম্প্রসারণযোগ্য করে তোলে (উপরের কোড থেকে উদ্ধৃত):
      // check the grid range
      while (ticker.Last >= net[net.length - 1].price) {   // if the price exceeds the grid line with the highest price in the grid,
          net.push({                                       // add a new grid line after the grid line with the highest price in the grid
              buy : false,                                 // initialize the sell mark
              sell : false,                                // initialize the buy mark
              price : net[net.length - 1].price + diff,    // add a grid interval on the basis of the previous highest price
          })
      }
      while (ticker.Last <= net[0].price) {                // if the price is lower than the grid line with the lowest price in the grid,
          var price = net[0].price - diff                  // distinguished from adding upwards, you should notice the price of the newly added grid line downwards cannot be less than or equal to 0, so you need to judge here
          if (price <= 0) {                                // do not add when the price is less than or equal to 0, and break the loop
              break
          }
          net.unshift({                                    // add a new grid line before the grid line with the lowest price in the grid
              buy : false,
              sell : false,
              price : price,
          })
      }
এর পর, আমাদের ট্রেডিং ট্রিগার কিভাবে বাস্তবায়ন করতে হয় তা বিবেচনা করতে হবে।
var diff = 50
var amount = 0.002       // add a global variable, which can also be designed as a parameter; for easy explanation, we can write it in an infinite loop
                         // the parameter controls the trading amount on the grid line each time the trading is triggered
function main() {
    var ticker = _C(exchange.GetTicker)
    var net = createNet(ticker.Last, diff)
    var preTicker = ticker       // before the start of the main (infinite) loop, set a variable, to record the market quotes of last time
    while (true) {
        ticker = _C(exchange.GetTicker)
        // check the grid range
        while (ticker.Last >= net[net.length - 1].price) {
            net.push({
                buy : false,
                sell : false,
                price : net[net.length - 1].price + diff,
            })
        }
        while (ticker.Last <= net[0].price) {
            var price = net[0].price - diff
            if (price <= 0) {
                break
            }
            net.unshift({
                buy : false,
                sell : false,
                price : price,
            })
        }

        // index the grid
        for (var i = 0 ; i < net.length ; i++) {     // traverse all grid lines in the grid data structure
            var p = net[i]
            if (preTicker.Last < p.price && ticker.Last > p.price) {         // upcross, and sell; when the current node has been traded, no matter SELL or BUY, no more trade
                if (i != 0) {
                    var downP = net[i - 1]
                    if (downP.buy) {
                        exchange.Sell(-1, amount, ticker)
                        downP.buy = false
                        p.sell = false
                        continue
                    }
                }
                if (!p.sell && !p.buy) {
                    exchange.Sell(-1, amount, ticker)
                    p.sell = true
                }
            } else if (preTicker.Last > p.price && ticker.Last < p.price) {  // downcross, and buy
                if (i != net.length - 1) {
                    var upP = net[i + 1]
                    if (upP.sell) {
                        exchange.Buy(-1, amount * ticker.Last, ticker)
                        upP.sell = false
                        p.buy = false
                        continue
                    }
                }
                if (!p.buy && !p.sell) {
                    exchange.Buy(-1, amount * ticker.Last, ticker)
                    p.buy = true
                }
            }
        }
        preTicker = ticker    // record the current market quotes in preTicker, which will be used as the "last" market quote data to compare with the new one in next loop, to judge upcross and downcross
        Sleep(500)
    }
}
আপনি দেখতে পাচ্ছেন:
- গ্রিড লাইন অতিক্রম করার অবস্থাঃ
preTicker.Last < p.price && ticker.Last > p.price - গ্রিড লাইন অতিক্রম করার অবস্থাঃ
preTicker.Last > p.price && ticker.Last < p.price
গত নিবন্ধে এই বিষয়ে আলোচনা করা হয়েছিল:
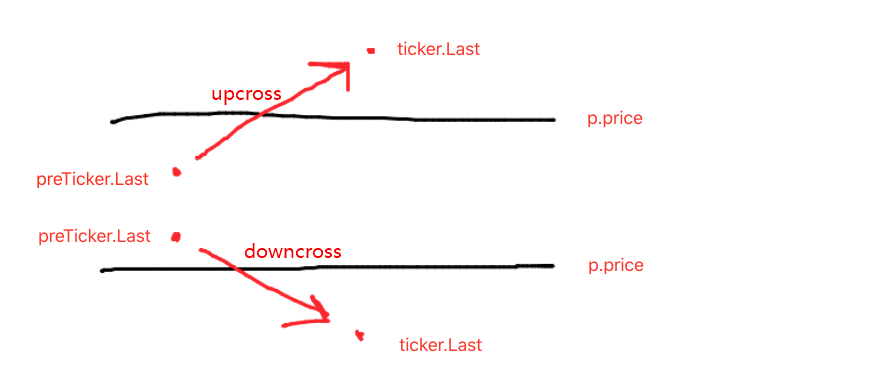
আপক্রস বা ডাউনক্রস বিচার করা অর্ডার এবং ট্রেড করার সিদ্ধান্ত নেওয়ার প্রথম পদক্ষেপ এবং গ্রিড লাইনের ডেটাতে চিহ্নটিও বিচার করা দরকার।
যদি এটি আপক্রস হয়, তাহলে বিচার করুন যে বর্তমান গ্রিড লাইনের দাম বর্তমান গ্রিড লাইনের তুলনায় কম কিনা, সেইসাথে সর্বশেষ গ্রিড লাইনের ক্রয় চিহ্ন; যদি ক্রয় চিহ্নের মান সত্য হয়, এর অর্থ হল শেষ গ্রিড লাইনের ক্রয় কার্যকর করা হয়েছে, এবং সর্বশেষ গ্রিড লাইনের ক্রয় চিহ্নটি মিথ্যা হিসাবে পুনরায় সেট করুন, এবং বর্তমান গ্রিড লাইনের বিক্রয় চিহ্নটি মিথ্যা হিসাবে পুনরায় সেট করুন।
এখনই উল্লিখিত শর্তগুলি বিচার করার পরে, যদি তারা ট্রিগার না হয়, বিচার চালিয়ে যান। যদি বর্তমান গ্রিড লাইনের ক্রয় চিহ্ন এবং বিক্রয় চিহ্ন উভয়ই মিথ্যা হয় তবে এর অর্থ হ'ল বর্তমান গ্রিড লাইনটি বাণিজ্য করতে পারে; কারণ এটি আপক্রস, এখানে আমরা বিক্রয় অপারেশনটি সম্পাদন করি এবং কার্যকর হওয়ার পরে গ্রিড লাইনের বিক্রয় চিহ্নটি সত্য হিসাবে চিহ্নিত করি।
ডাউনক্রস প্রক্রিয়াকরণের যুক্তি একই। (নবীনরা নিজেরাই এটি চিন্তা করতে পারে)
- গ্রিড লাইন অতিক্রম করার অবস্থাঃ
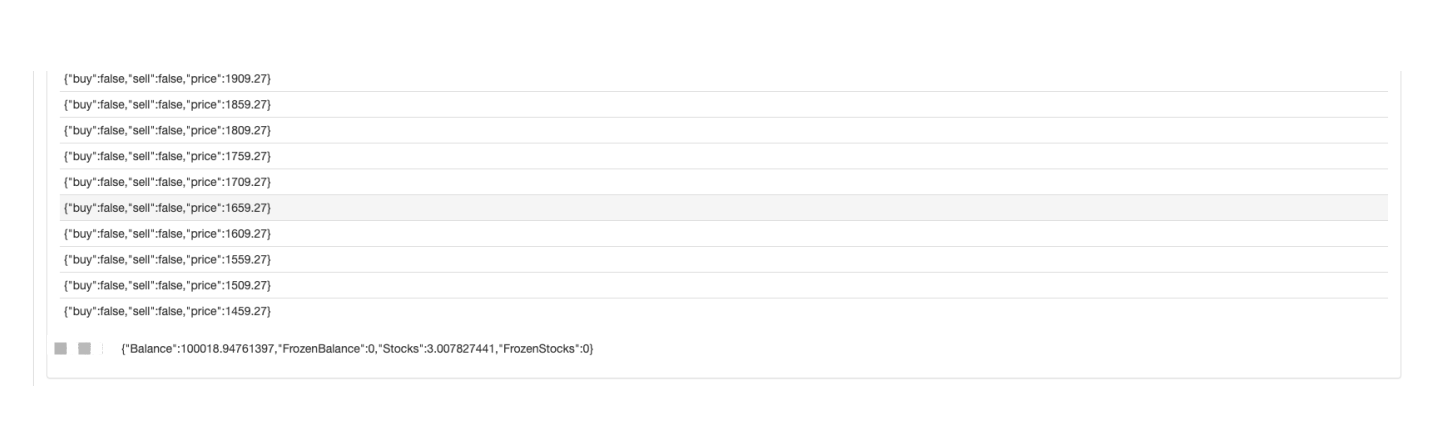
সম্পূর্ণ কৌশল ব্যাকটেস্ট
ব্যাকটেস্টের সময় কিছু তথ্য দেখতে, একটি ফাংশনshowTblতথ্য প্রদর্শনের জন্য লেখা হয়।
function showTbl(arr) {
    var tbl = {
        type : "table",
        title : "grid",
        cols : ["grid information"],
        rows : []
    }
    var arrReverse = arr.slice(0).reverse()
    _.each(arrReverse, function(ele) {
        var color = ""
        if (ele.buy) {
            color = "#FF0000"
        } else if (ele.sell) {
            color = "#00FF00"
        }
        tbl.rows.push([JSON.stringify(ele) + color])
    })
    LogStatus(_D(), "\n`" + JSON.stringify(tbl) + "`", "\n account information:", exchange.GetAccount())
}
সম্পূর্ণ কৌশল কোডঃ
/*backtest
start: 2021-04-01 22:00:00
end: 2021-05-22 00:00:00
period: 1d
basePeriod: 1m
exchanges: [{"eid":"OKEX","currency":"ETH_USDT","balance":100000}]
*/

var diff = 50
var amount = 0.002
function createNet(begin, diff) {
    var oneSideNums = 10
    var up = []
    var down = []
    for (var i = 0 ; i < oneSideNums ; i++) {
        var upObj = {
            buy : false,
            sell : false,
            price : begin + diff / 2 + i * diff,
        }
        up.push(upObj)

        var j = (oneSideNums - 1) - i
        var downObj = {
            buy : false,
            sell : false,
            price : begin - diff / 2 - j * diff,
        }
        if (downObj.price <= 0) {  // the price cannot be less than or equal to 0
            continue
        }
        down.push(downObj)
    }

    return down.concat(up)
}

function showTbl(arr) {
    var tbl = {
        type : "table",
        title : "grid",
        cols : ["grid information"],
        rows : []
    }
    var arrReverse = arr.slice(0).reverse()
    _.each(arrReverse, function(ele) {
        var color = ""
        if (ele.buy) {
            color = "#FF0000"
        } else if (ele.sell) {
            color = "#00FF00"
        }
        tbl.rows.push([JSON.stringify(ele) + color])
    })
    LogStatus(_D(), "\n`" + JSON.stringify(tbl) + "`", "\n account information:", exchange.GetAccount())
}

function main() {
    var ticker = _C(exchange.GetTicker)
    var net = createNet(ticker.Last, diff)
    var preTicker = ticker
    while (true) {
        ticker = _C(exchange.GetTicker)
        // check the grid range
        while (ticker.Last >= net[net.length - 1].price) {
            net.push({
                buy : false,
                sell : false,
                price : net[net.length - 1].price + diff,
            })
        }
        while (ticker.Last <= net[0].price) {
            var price = net[0].price - diff
            if (price <= 0) {
                break
            }
            net.unshift({
                buy : false,
                sell : false,
                price : price,
            })
        }

        // index grid
        for (var i = 0 ; i < net.length ; i++) {
            var p = net[i]
            if (preTicker.Last < p.price && ticker.Last > p.price) {         // upcross, and sell; when the current node has been traded, no matter SELL or BUY, no more trade
                if (i != 0) {
                    var downP = net[i - 1]
                    if (downP.buy) {
                        exchange.Sell(-1, amount, ticker)
                        downP.buy = false
                        p.sell = false
                        continue
                    }
                }
                if (!p.sell && !p.buy) {
                    exchange.Sell(-1, amount, ticker)
                    p.sell = true
                }
            } else if (preTicker.Last > p.price && ticker.Last < p.price) {  // downcross, and buy
                if (i != net.length - 1) {
                    var upP = net[i + 1]
                    if (upP.sell) {
                        exchange.Buy(-1, amount * ticker.Last, ticker)
                        upP.sell = false
                        p.buy = false
                        continue
                    }
                }
                if (!p.buy && !p.sell) {
                    exchange.Buy(-1, amount * ticker.Last, ticker)
                    p.buy = true
                }
            }
        }

        showTbl(net)
        preTicker = ticker
        Sleep(500)
    }
}
কৌশল ব্যাকটেস্ট:
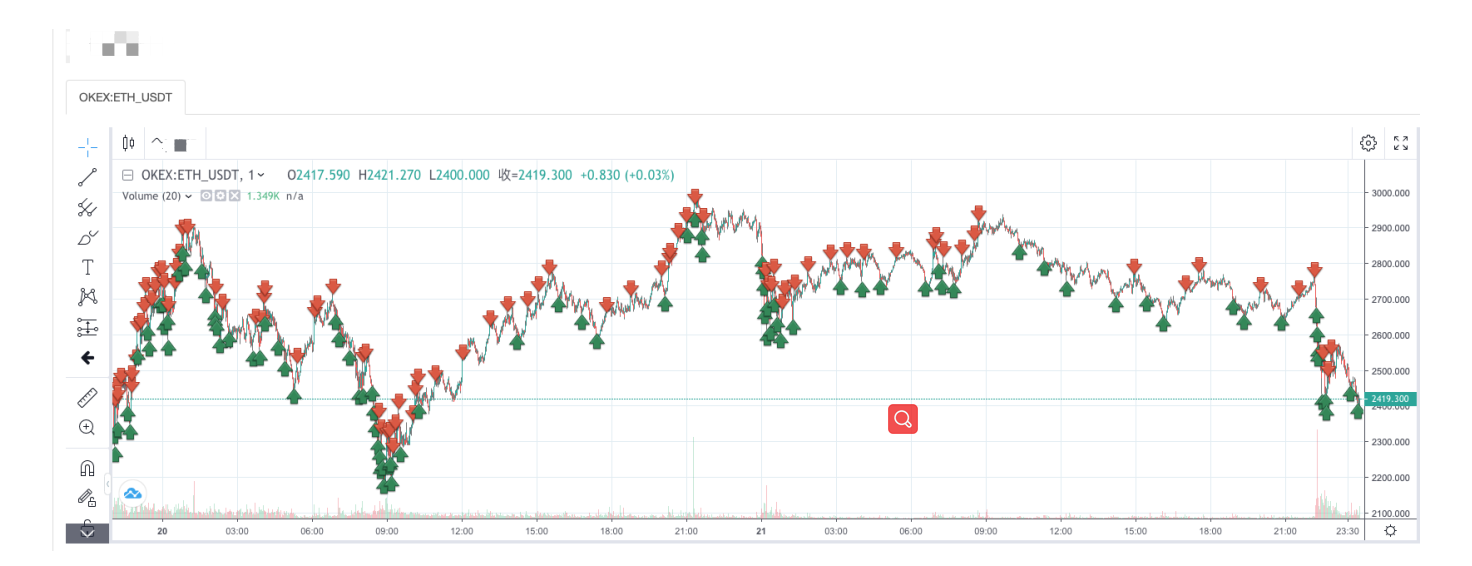
আপনি গ্রিড কৌশলটির বৈশিষ্ট্য দেখতে পাচ্ছেন যখন একটি ট্রেন্ডিং মার্কেট থাকে, তখন একটি বড় ফ্লোটিং লস হবে, এবং রিটার্ন একটি অস্থির মার্কেটে পুনরুদ্ধার হবে। সুতরাং, গ্রিড কৌশল ঝুঁকিমুক্ত নয়। স্পট কৌশল এখনও এটি এমনকি করতে ধরে রাখতে পারে, যখন ফিউচার চুক্তির গ্রিড কৌশল আরও ঝুঁকিপূর্ণ এবং গ্রিড পরামিতি সংরক্ষণশীলভাবে সেট করতে হবে।
- my ভাষায় কিভাবে এখানে লিখতে হয় যাতে একটি সংকেত থাকে এবং একবার প্রিন্ট ও আউটপুট করতে হয়।
- ডেরিবিত অপশনের ডায়নামিক ডেল্টা হেজিং
- FMZ কোয়ান্ট ডাটাবেস তৈরি করতে SQLite ব্যবহার করুন
- শিক্ষানবিস, এটি পরীক্ষা করে দেখুন
আপনাকে ক্রিপ্টোকারেন্সি পরিমাণগত ট্রেডিংয়ে নিয়ে যান (8) - শিক্ষানবিস, এটি পরীক্ষা করে দেখুন
আপনাকে ক্রিপ্টোকারেন্সি পরিমাণগত ট্রেডিংয়ে নিয়ে যান (7) - নবাগত, এটি দেখুন
আপনাকে ক্রিপ্টোকারেন্সি পরিমাণগত ট্রেডিংয়ে নিয়ে যান (6) - নবাগত, এটি পরীক্ষা করুন
আপনাকে ক্রিপ্টোকারেন্সি পরিমাণগত ট্রেডিংয়ে নিয়ে যান (3) - নবাগত, এটি পরীক্ষা করে দেখুন
আপনাকে ক্রিপ্টোকারেন্সি পরিমাণগত ট্রেডিংয়ে নিয়ে যান (2) - আমার আবিষ্কারকের টাইমিং ভুল।
- আপনি কি আমাদেরকে আপনার মতামত এবং আপনার মতামত সম্পর্কে কিছু বলতে পারেন?
- শিক্ষানবিস, এটি পরীক্ষা করুন
আপনাকে ক্রিপ্টোকারেন্সি পরিমাণগত ট্রেডিংয়ে নিয়ে যান (4) - অর্ডার তৈরির সময় এবং অর্ডার সমাপ্তির সময়
- মার্টিনের জন্য ট্রেডিং নেট কৌশল
- ভাইয়েরা, আমার ভাষার জন্য এই কোডটি ব্যাখ্যা করুন_TR:=MAX ((MAX (((HIGH-LOW),ABS ((REF ((CLOSE,1)-HIGH)),ABS ((REF ((CLOSE,1)-LOW));
- রিয়েল-ডিস্ক ত্রুটি রিপোর্ট প্রশ্ন
- শিক্ষানবিস, এটি দেখুন
আপনাকে ক্রিপ্টোকারেন্সি পরিমাণগত ট্রেডিংয়ে নিয়ে যান (1) - টাইপস্ক্রিপ্ট সমর্থন যোগ করা যাবে?
- ক্রিপ্টোকারেন্সি স্পট হেজিং কৌশল (2)
- ক্রিপ্টোকারেন্সি স্পট হেজিং কৌশল (1)
- বিটজেট এপিআই-তে, ADA, AVAX, AXS, BCH, DOT, EOS, ETC, FIL, LINK, LTC, LUNA, MATIC, SOL, XRP-র সাথে ট্রেডিংয়ের জন্য সমস্যা দেখা দেয়।