সুপার ট্রেন্ড অনুসরণ করে স্টপ লস কৌশল


সৃষ্টির তারিখ: 2023-12-19 11:20:15 অবশেষে সংশোধন করুন: 2023-12-19 11:20:15
অনুলিপি: 0 ক্লিকের সংখ্যা: 607
1
ফোকাস
1621
অনুসারী

সুপার ট্রেন্ড অনুসরণ করে স্টপ লস কৌশল

ওভারভিউ

এই কৌশলটি ওভারট্রেন্ডিং সূচক এবং ট্র্যাকিং স্টপ লসের উপর ভিত্তি করে পজিশন খোলার জন্য। এটি 4 টি অ্যালার্ম ব্যবহার করে এবং ওভারট্রেন্ডিং কৌশল ব্যবহার করে। এই কৌশলটি বিশেষভাবে রোবট ডিজাইনের জন্য ডিজাইন করা হয়েছে, যার ট্র্যাকিং স্টপ লস রয়েছে।

কৌশল নীতি

এই কৌশলটি এটিআর সূচক ব্যবহার করে ট্রেল আপ এবং ট্রেল আউট গণনা করে। যখন ক্লোজিং মূল্যটি ট্রেল আপ ভেঙে দেয় তখন এটি একটি কেনার সংকেত দেয় এবং যখন এটি ট্রেল আউট হয় তখন এটি একটি বিক্রয় সংকেত দেয়। কৌশলটি ট্রেন্ডের দিক নির্ধারণের জন্য সুপার ট্রেন্ড লাইন ব্যবহার করে। যখন সুপার ট্রেন্ড লাইনটি অতিক্রম করা হয়, তখন একটি ষাঁড়ের বাজার শুরু হয়; যখন সুপার ট্রেন্ড লাইনটি অতিক্রম করা হয়, তখন একটি ভালর বাজার শুরু হয়। কৌশলটি একটি সংকেত তৈরি করার সময় একটি পজিশন খোলে এবং একই সাথে একটি প্রাথমিক স্টপ লস মূল্য সেট করে। তারপরে দামের পরিবর্তনের উপর ভিত্তি করে স্টপ লস মূল্যটি সামঞ্জস্য করে, যার ফলে মুনাফা লক করা যায় এবং স্টপ লস ট্র্যাকিংয়ের প্রভাব অর্জন করা যায়।

সামর্থ্য বিশ্লেষণ

এই কৌশলটি ট্রেন্ডের দিকনির্দেশনা নির্ধারণের জন্য সুপার ট্রেন্ডিং সূচক এবং এটিআর সূচকের স্টপ লস সেট করার সুবিধা নিয়ে গঠিত, যা কার্যকরভাবে মিথ্যা ব্রেকআউটগুলি ফিল্টার করতে পারে। স্টপ লস ট্র্যাকিং ভালভাবে মুনাফা লক করতে পারে এবং প্রত্যাহারকে হ্রাস করতে পারে। এছাড়াও, কৌশলটি বিশেষভাবে রোবটের জন্য ডিজাইন করা হয়েছে, যা ট্রেডিংকে স্বয়ংক্রিয় করতে পারে।

ঝুঁকি বিশ্লেষণ

সুপারট্রেন্ডিং সূচকগুলি আরও বেশি ভুল সংকেত তৈরি করতে পারে। স্টপ প্রাইসের সমন্বয় যখন বড় হয়, তখন স্টপ ক্ষতিগ্রস্থ হওয়ার সম্ভাবনা বাড়ায়। এছাড়াও, রোবট ট্রেডিং সার্ভার ক্র্যাশ, নেটওয়ার্ক বিঘ্নিত ইত্যাদি প্রযুক্তিগত ঝুঁকির মুখোমুখি হয়।

ভুল সংকেতের সম্ভাবনা হ্রাস করার জন্য, এটিআর প্যারামিটারগুলি যথাযথভাবে সামঞ্জস্য করা বা অন্যান্য সূচক যুক্ত করে ফিল্টার করা যেতে পারে। স্টপ লস ট্র্যাকিংয়ের মাত্রা সামঞ্জস্য করার সময় লাভ এবং ঝুঁকিকে ভারসাম্য বজায় রাখা প্রয়োজন। প্রযুক্তিগত ব্যর্থতার ঝুঁকি রোধ করতে ব্যাকআপ সার্ভার এবং নেটওয়ার্ক প্রস্তুত রাখুন।

অপ্টিমাইজেশান দিক

এই কৌশলটি নিম্নলিখিত দিকগুলি থেকে উন্নত করা যেতে পারেঃ

  1. প্রবেশের সংকেতগুলি ফিল্টার করতে এবং ভুল সংকেতগুলি এড়াতে একটি সূচক বা শর্ত যুক্ত করুন। উদাহরণস্বরূপ, একটি MACD সূচক যুক্ত করা যেতে পারে।

  2. এটিআর প্যারামিটারগুলির বিভিন্ন সংমিশ্রণ পরীক্ষা করে সর্বোত্তম প্যারামিটারটি খুঁজে বের করতে পারে।

  3. স্টপ লস ট্র্যাকিংয়ের মাত্রা অনুকূলিতকরণ এবং সর্বোত্তম ভারসাম্য খুঁজে বের করা।

  4. আপনি আরও স্টপ-অফ দাম যোগ করতে পারেন, যাতে আপনি ব্যাচ স্টপ করতে পারেন।

  5. প্রধান সার্ভার ব্যর্থ হলে দ্রুত স্যুইচ করার জন্য একটি প্রধান ব্যাকআপ দ্বৈত সার্ভার আর্কিটেকচার স্থাপন করা যেতে পারে।

সারসংক্ষেপ

এই কৌশলটি ট্রান্সট্রেন্ডিং সূচক এবং স্টপ ট্র্যাকিংয়ের সুবিধাগুলিকে একত্রিত করে, পজিশন খোলার এবং স্টপগুলি স্বয়ংক্রিয় করতে পারে। রিয়েল-স্টোরে অপ্টিমাইজেশান দিকনির্দেশনাগুলির সাথে সংযুক্ত উন্নতিগুলি একটি খুব কার্যকর পরিমাণযুক্ত ট্রেডিং কৌশল হতে পারে।
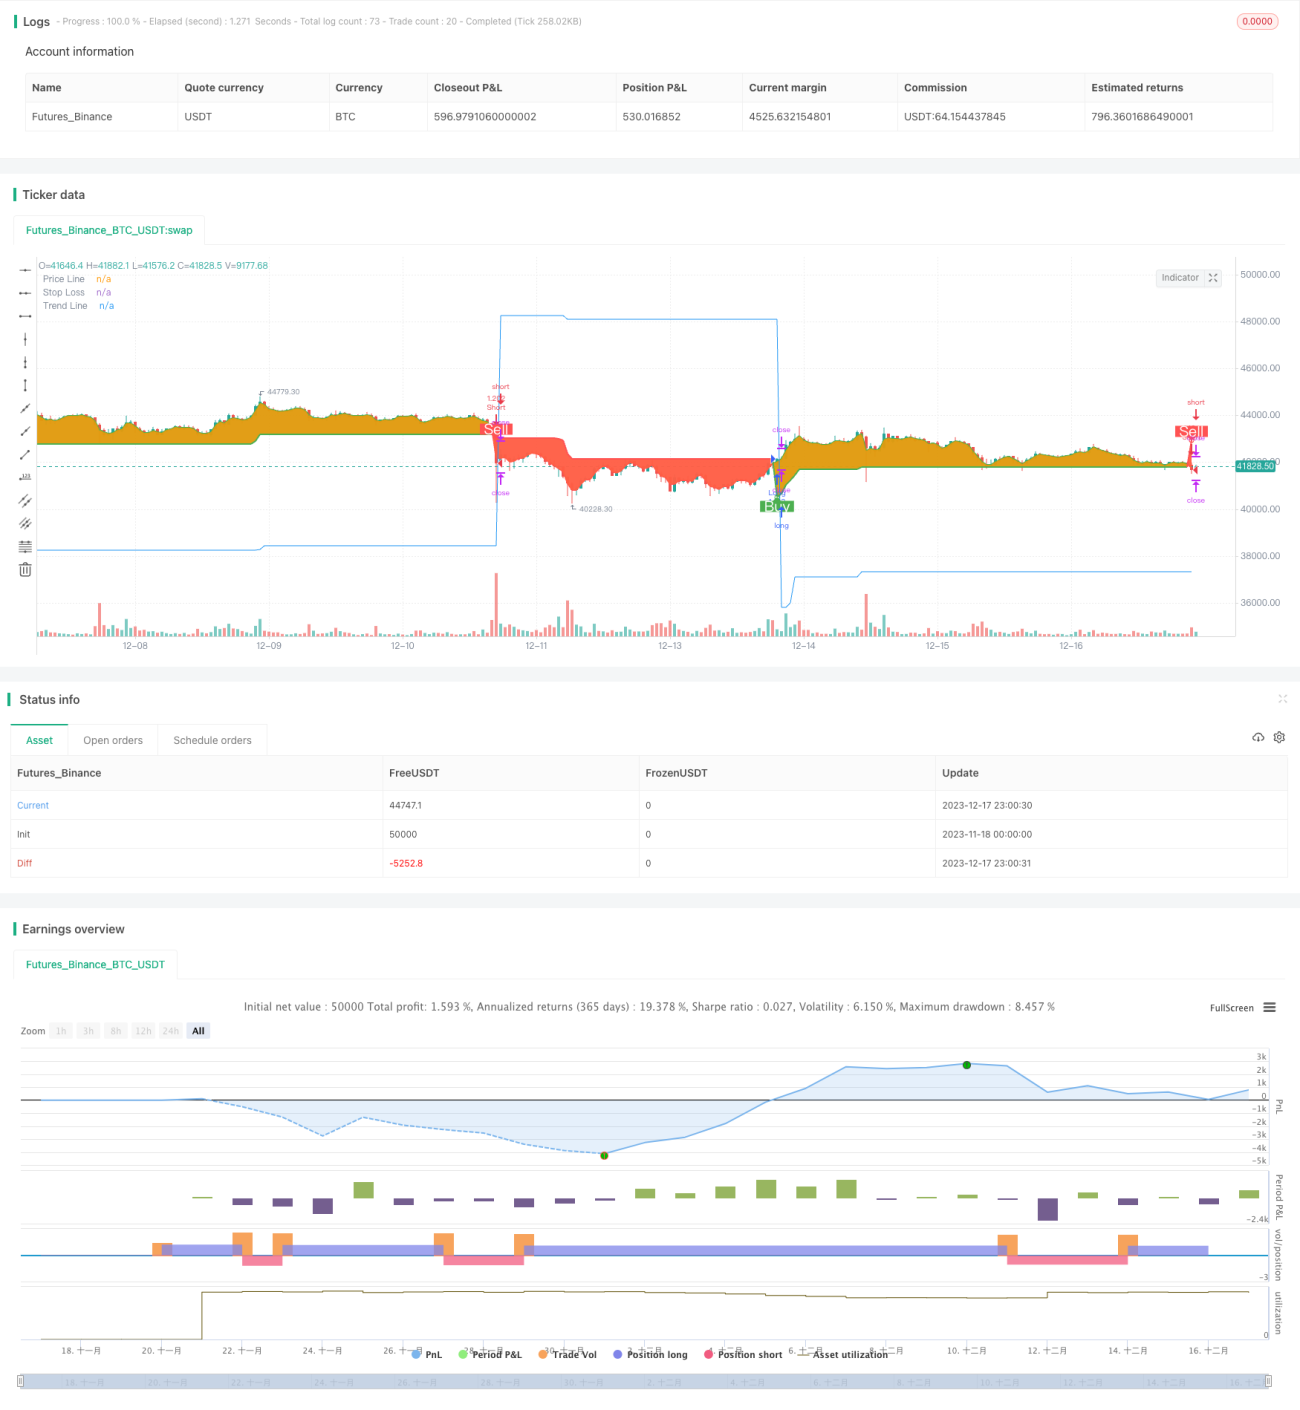
কৌশল সোর্স কোড
/*backtest
start: 2023-11-18 00:00:00
end: 2023-12-18 00:00:00
period: 1h
basePeriod: 15m
exchanges: [{"eid":"Futures_Binance","currency":"BTC_USDT"}]
*/

// This source code is subject to the terms of the Mozilla Public License 2.0 at https://mozilla.org/MPL/2.0/
// © arminomid1375
//@version=5
strategy('Mizar_BOT_super trend', overlay=true, default_qty_value=100, currency=currency.USD, default_qty_type=strategy.percent_of_equity, initial_capital=100, max_bars_back=4000)


//===== INPUTS ==========================================================================//

factor = input.float(4.5, title='ATR Factor', step=0.1,group = 'ATR')
period = input.int(59, minval=1, maxval=100, title='ATR Period',group = 'ATR')
up = (high + low) / 2 - factor * ta.atr(period)
down = (high + low) / 2 + factor * ta.atr(period)
trend_up = 0.0
trend_up := close[1] > trend_up[1] ? math.max(up, trend_up[1]) : up
trend_down = 0.0
trend_down := close[1] < trend_down[1] ? math.min(down, trend_down[1]) : down
trend = 0.0
trend := close > trend_down[1] ? 1 : close < trend_up[1] ? -1 : nz(trend[1], 1)
tsl = trend == 1 ? trend_up : trend_down
line_color = trend == 1 ? 'green' : 'red'
long_signal = trend == 1 and trend[1] == -1
short_signal = trend == -1 and trend[1] == 1
background = true


//ss =  input.float(defval=15.0, minval=0.0, title=' stop loss %',group = 'stop loss')
use_sl = input(title='trailing stop ?', defval=true,group = 'stop loss')
initial_sl_pct = input.float(defval=15.0, minval=0.0, title='trailing stop %',group = 'stop loss')

Tpactive1 = input(title='Take profit1 On/Off ?', defval=true, group='take profit')
tp1percent = input.float(5.0, title='TP1 %', group='take profit') *100
tp1amt = input.int(10, title='TP1 Amount %', group='take profit')
Tpactive2 = input(title='Take profit2 On/Off ?', defval=true, group='take profit')
tp2percent = input.float(10, title='TP2 %', group='take profit') *100
tp2amt = input.int(15, title='TP2 Amount %', group='take profit')
Tpactive3 = input(title='Take profit3 On/Off ?', defval=true, group='take profit')
tp3percent = input.float(15, title='TP3 %', group='take profit')*100
tp3amt = input.int(20, title='TP3 Amount %', group='take profit')

//===== TIMEFRAME ==========================================================================//

from_month = input.int(defval=1, title='From Month', minval=1, maxval=12)
from_day = input.int(defval=1, title='From Day', minval=1, maxval=31)
from_year = input.int(defval=2019, title='From Year', minval=2017)
to_month = input.int(defval=1, title='To Month', minval=1, maxval=12)
to_day = input.int(defval=1, title='To Day', minval=1, maxval=31)
to_year = input.int(defval=9999, title='To Year', minval=2017)
start = timestamp(from_year, from_month, from_day, 00, 00)

finish = timestamp(to_year, to_month, to_day, 23, 59)
window() =>
    time >= start and time <= finish ? true : false

//===== PLOTS ==========================================================================//

// Line
line_plot = plot(tsl, color=trend == 1 ? color.green : color.red, linewidth=2, title='Trend Line')
// Labels
plotshape(long_signal and window() ? up : na, title='Buy', text='Buy', location=location.absolute, style=shape.labelup, size=size.normal, color=color.new(color.green, 0), textcolor=color.new(color.white, 0))
plotshape(short_signal and window() ? down : na, title='Sell', text='Sell', location=location.absolute, style=shape.labeldown, size=size.normal, color=color.new(color.red, 0), textcolor=color.new(color.white, 0))
// Circles
plotshape(long_signal and window() ? up : na, title='Uptrend starts', location=location.absolute, style=shape.circle, size=size.tiny, color=color.new(color.green, 0))
plotshape(short_signal and window() ? down : na, title='Downtrend starts', location=location.absolute, style=shape.circle, size=size.tiny, color=color.new(color.red, 0))
// Background
long_fill = background ? trend == 1 ? color.green : na : na
short_fill = background ? trend == -1 ? color.red : na : na
candle_plot = plot(ohlc4, title='Price Line', color=trend == 1 ? long_fill : short_fill, linewidth=2, transp=90)
fill(candle_plot, line_plot, title='Long Background', color=long_fill, transp=90)
fill(candle_plot, line_plot, title='Short Background', color=short_fill, transp=90)

//===== GLOBAL ==========================================================================//

var entry_price = 0.0
var updated_entry_price = 0.0
var sl_price = 0.0

longString = "Input your custom alert message here.\nAnd put {{strategy.order.alert_message}} in the message box."
longclose = "Input your custom alert message here.\nAnd put {{strategy.order.alert_message}} in the message box."
shortString = "Input your custom alert message here.\nAnd put {{strategy.order.alert_message}} in the message box."
shortclose = "Input your custom alert message here.\nAnd put {{strategy.order.alert_message}} in the message box."


longAlertMessage = input(title="Long Alert Message", defval="long", group="Alert Messages", tooltip=longString)
longcloseAlertMessage = input(title="Long close Alert Message", defval="long", group="Alert Messages", tooltip=longclose)
shortAlertMessage = input(title="Short Alert Message", defval="short", group="Alert Messages", tooltip=shortString)
shortcloseAlertMessage = input(title="Short close Alert Message", defval="short", group="Alert Messages", tooltip=shortclose)


has_open_trade() =>
    strategy.position_size != 0
has_no_open_trade() =>
    strategy.position_size == 0

is_long() =>
    strategy.position_size > 0 ? true : false
is_short() =>
    strategy.position_size < 0 ? true : false

plot(use_sl ? has_no_open_trade() ? close : sl_price : na, color=has_no_open_trade() ? na : color.blue, title='Stop Loss')

strategy_close() =>
    if is_long()
        strategy.close('Long')
        alert(longcloseAlertMessage)
    if is_short()
        strategy.close('Short')
        alert(shortcloseAlertMessage)


strategy_long() =>
    strategy.entry('Long', strategy.long)    


strategy_short() =>
    strategy.entry('Short', strategy.short)

sl_pct = initial_sl_pct
if long_signal or is_long() and not(short_signal or is_short())
    sl_pct := initial_sl_pct * -1
    sl_pct

//===== STRATEGY ==========================================================================//


crossed_sl = false
if is_long() and use_sl
    crossed_sl := close <= sl_price
    crossed_sl
if is_short() and use_sl
    crossed_sl := close >= sl_price
    crossed_sl

terminate_operation = window() and has_open_trade() and crossed_sl

if terminate_operation and not(long_signal or short_signal)  // Do not close position if trend is flipping anyways.
    entry_price := 0.0
    updated_entry_price := entry_price
    sl_price := 0.0
    strategy_close()


start_operation = window() and (long_signal or short_signal)

if start_operation
    entry_price := close
    updated_entry_price := entry_price
    sl_price := entry_price + entry_price * sl_pct / 100
    if long_signal
        strategy_long()
        if Tpactive1==true
            strategy.exit('TPL1','Long', qty_percent=tp1amt,profit =tp1percent)

        alert(shortcloseAlertMessage)
        alert(longAlertMessage)
    

    if short_signal
        strategy_short()
        if Tpactive1==true
            strategy.exit('TPL1','Short', qty_percent=tp1amt,profit =tp1percent)

        alert(longcloseAlertMessage)
        alert(shortAlertMessage)


//===== TRAILING ==========================================================================//

if is_long() and use_sl
    strategy_pct = (close - updated_entry_price) / updated_entry_price * 100.00
    if strategy_pct > 1
        sl_pct += strategy_pct - 1.0
        new_sl_price = updated_entry_price + updated_entry_price * sl_pct / 100
        sl_price := math.max(sl_price, new_sl_price)
        updated_entry_price := sl_price
        updated_entry_price
        

if is_short() and use_sl
    strategy_pct = (close - updated_entry_price) / updated_entry_price * 100.00
    if strategy_pct < -1
        sl_pct += strategy_pct + 1.0
        new_sl_price = updated_entry_price + updated_entry_price * sl_pct / 100
        sl_price := math.min(sl_price, new_sl_price)
        updated_entry_price := sl_price
        updated_entry_price