RSI এবং বলিঞ্জার ব্যান্ডস ডুয়াল স্ট্র্যাটেজি

ওভারভিউ
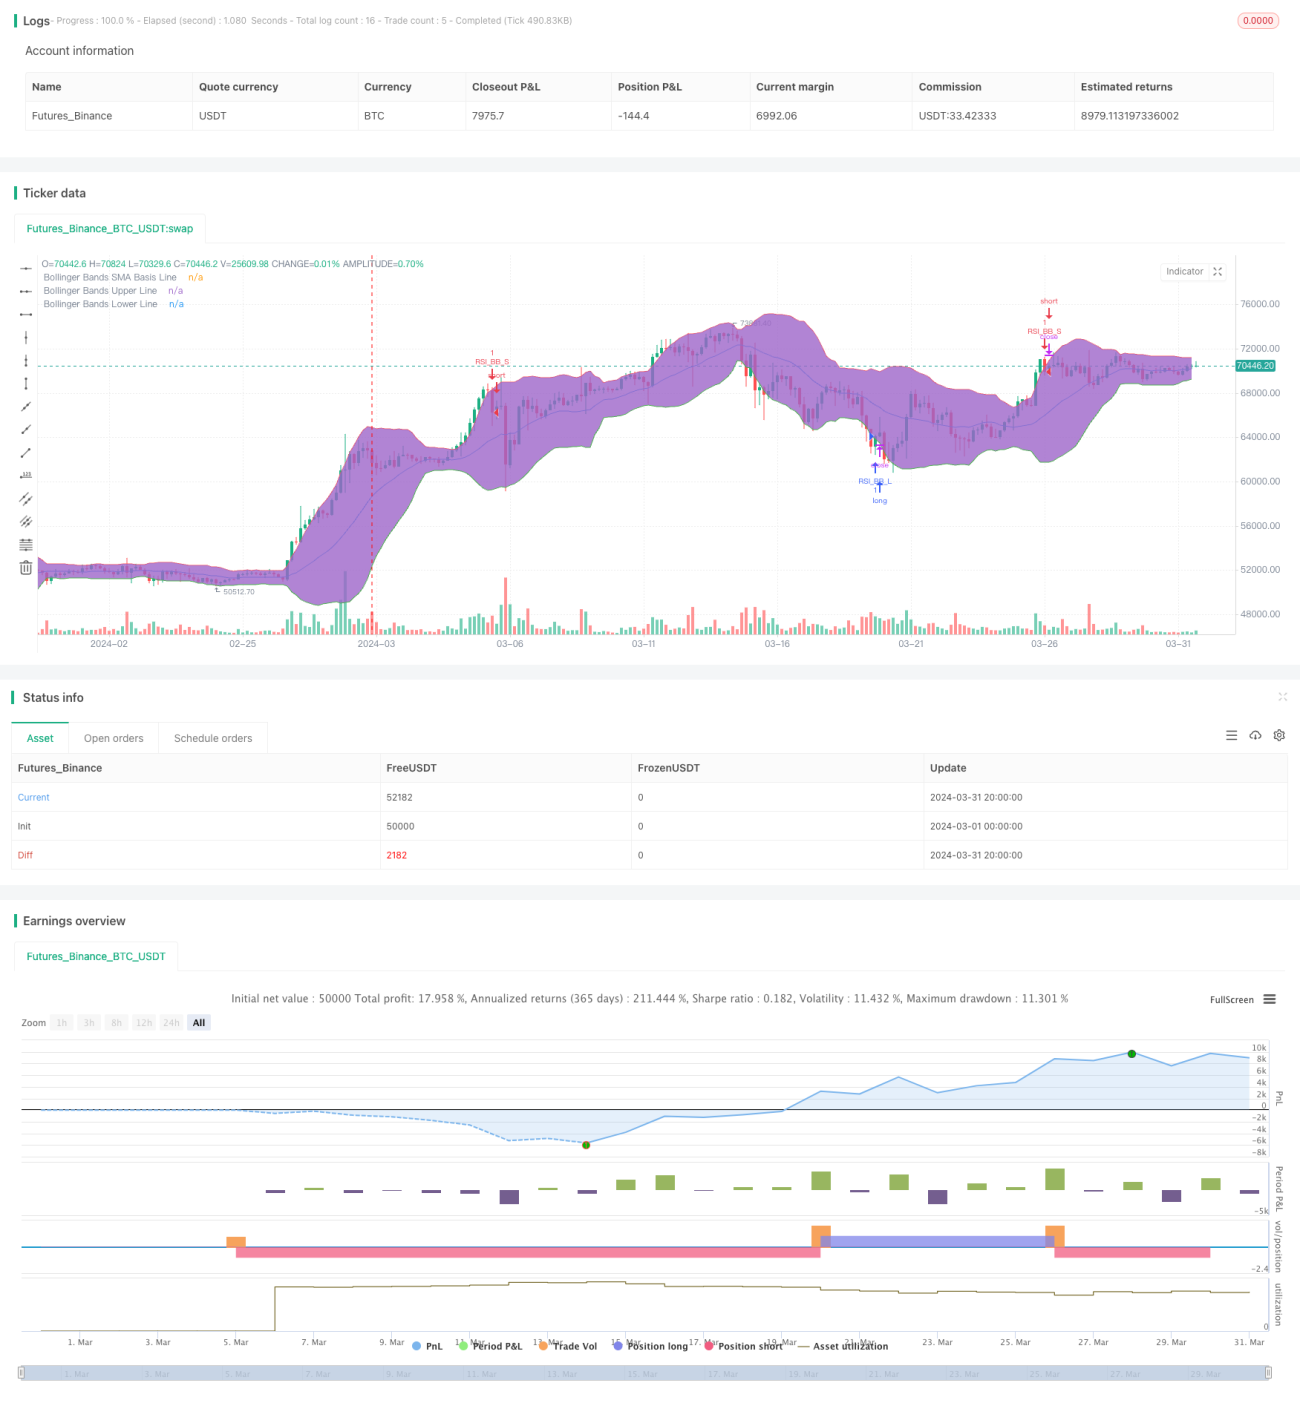
এই কৌশলটি তুলনামূলকভাবে দুর্বল সূচক ((আরএসআই) এবং বোলিংগার ব্যান্ডস ((বোলিংগার ব্যান্ডস) এর দুটি প্রযুক্তিগত সূচককে একত্রিত করে, যখন দামগুলি বোলিং ব্যান্ডের নীচে নেমে আসে তখন একটি কেনার সংকেত উত্পন্ন করে এবং যখন দামগুলি বোলিং ব্যান্ডের উপরে থাকে তখন একটি বিক্রয় সংকেত উত্পন্ন করে। এই কৌশলটি কেবলমাত্র যখন আরএসআই এবং বোলিং ব্যান্ডের সূচক একই সাথে ওভারসোল্ড বা ওভারবোলিং অবস্থায় থাকে তখনই একটি লেনদেনের সংকেত ট্রিগার করে।
কৌশল নীতি
- RSI মান নির্ধারিত RSI প্যারামিটার অনুযায়ী গণনা করা হয়।
- বুলিন ব্যান্ডের মধ্যম, উপরের এবং নিচের রেলগুলিকে বুলিন ব্যান্ডের সূত্র ব্যবহার করে গণনা করা হয়।
- বর্তমান ক্লোজ-আপ মূল্যটি ব্রিন-ব্যান্ডের উপরে বা নিচে চলে গেছে কিনা তা নির্ধারণ করুন।
- বর্তমান RSI মানটি ওভার-বই থ্রেশহোল্ডের উপরে বা ওভার-বই থ্রেশহোল্ডের নীচে কিনা তা নির্ধারণ করুন।
- যখন বুলিং ব্যান্ড এবং আরএসআই উভয়ই ক্রয় বা বিক্রয়ের শর্ত পূরণ করে, তখন সংশ্লিষ্ট ট্রেডিং সিগন্যাল তৈরি হয়।
কৌশলগত সুবিধা
- ট্রেন্ডিং এবং গতিশীলতা এই দুটি প্রযুক্তিগত সূচককে একত্রিত করে, এটি বাজারের অবস্থা সম্পর্কে আরও ব্যাপকভাবে বিচার করতে পারে।
- একই সময়ে, দুটি সূচককে ফিল্টারিংয়ের শর্ত হিসাবে ব্যবহার করা হয়, যা কার্যকরভাবে মিথ্যা সংকেতের সম্ভাবনা হ্রাস করে।
- কোড লজিক পরিষ্কার, প্যারামিটার সেটিং নমনীয়, বিভিন্ন বাজার পরিবেশ এবং ট্রেডিং শৈলী জন্য উপযুক্ত।
কৌশলগত ঝুঁকি
- এই কৌশলটি বাজারের অস্থিরতার সময় ক্ষতিগ্রস্ত লেনদেনের সম্ভাবনা বাড়িয়ে তুলতে পারে।
- ভুল প্যারামিটার সেট করার ফলে কৌশলটি খারাপভাবে কাজ করতে পারে এবং বাস্তব পরিস্থিতির উপর ভিত্তি করে অপ্টিমাইজেশান প্রয়োজন।
- এই কৌশলটি বন্ধ হওয়ার ঝুঁকি নিয়ে তৈরি করা হয়নি।
কৌশল অপ্টিমাইজেশনের দিকনির্দেশনা
- আরএসআই এবং ব্রিন ব্যান্ডের প্যারামিটারগুলি বাজারের বৈশিষ্ট্য এবং ব্যক্তিগত পছন্দ অনুসারে অপ্টিমাইজ করা যেতে পারে।
- সিগন্যালের নির্ভরযোগ্যতা বাড়াতে অন্যান্য প্রযুক্তিগত সূচক যেমন MACD, গড় লাইন ইত্যাদি প্রবর্তন করা হয়েছে।
- একক লেনদেনের ঝুঁকি নিয়ন্ত্রণের জন্য যুক্তিসঙ্গত স্টপ লস এবং স্টপস্টপ সেট করুন।
- একটি ঝড়ের বাজারের জন্য, সিদ্ধান্তের শর্তগুলি বাড়ানো বা অবস্থানগুলি হ্রাস করা বিবেচনা করা যেতে পারে, ঘন ঘন লেনদেনের ব্যয় হ্রাস করা যায়।
সারসংক্ষেপ
আরএসআই এবং বুলিন বন্ডের দ্বৈত কৌশলটি প্রবণতা এবং গতিশীলতার সূচকগুলির সংমিশ্রণের মাধ্যমে বাজারের অবস্থা সম্পর্কে একটি বিস্তৃত বিচার করতে পারে এবং সেই অনুযায়ী ট্রেডিং সংকেত দিতে পারে। তবে এই কৌশলটি অস্থির বাজারে দুর্বল পারফরম্যান্স করতে পারে এবং ঝুঁকি নিয়ন্ত্রণ ব্যবস্থা স্থাপন করা হয়নি, তাই রিয়েল-স্টোর ব্যবহারের সময় সতর্কতা অবলম্বন করা প্রয়োজন। প্যারামিটারগুলি অনুকূলিতকরণ, অন্যান্য সূচকগুলি প্রবর্তন এবং যুক্তিসঙ্গত স্টপ লস সেট করার মতো পদ্ধতিগুলি ব্যবহার করে কৌশলটির স্থায়িত্ব এবং লাভজনকতা আরও বাড়িয়ে তুলতে পারে।
/*backtest
start: 2024-03-01 00:00:00
end: 2024-03-31 23:59:59
period: 4h
basePeriod: 15m
exchanges: [{"eid":"Futures_Binance","currency":"BTC_USDT"}]
*/

//@version=4
strategy("Bollinger + RSI, Double Strategy (by ChartArt) v1.1", shorttitle="CA_-_RSI_Bol_Strat_1.1", overlay=true)

// ChartArt's RSI + Bollinger Bands, Double Strategy - Update- 1