概述
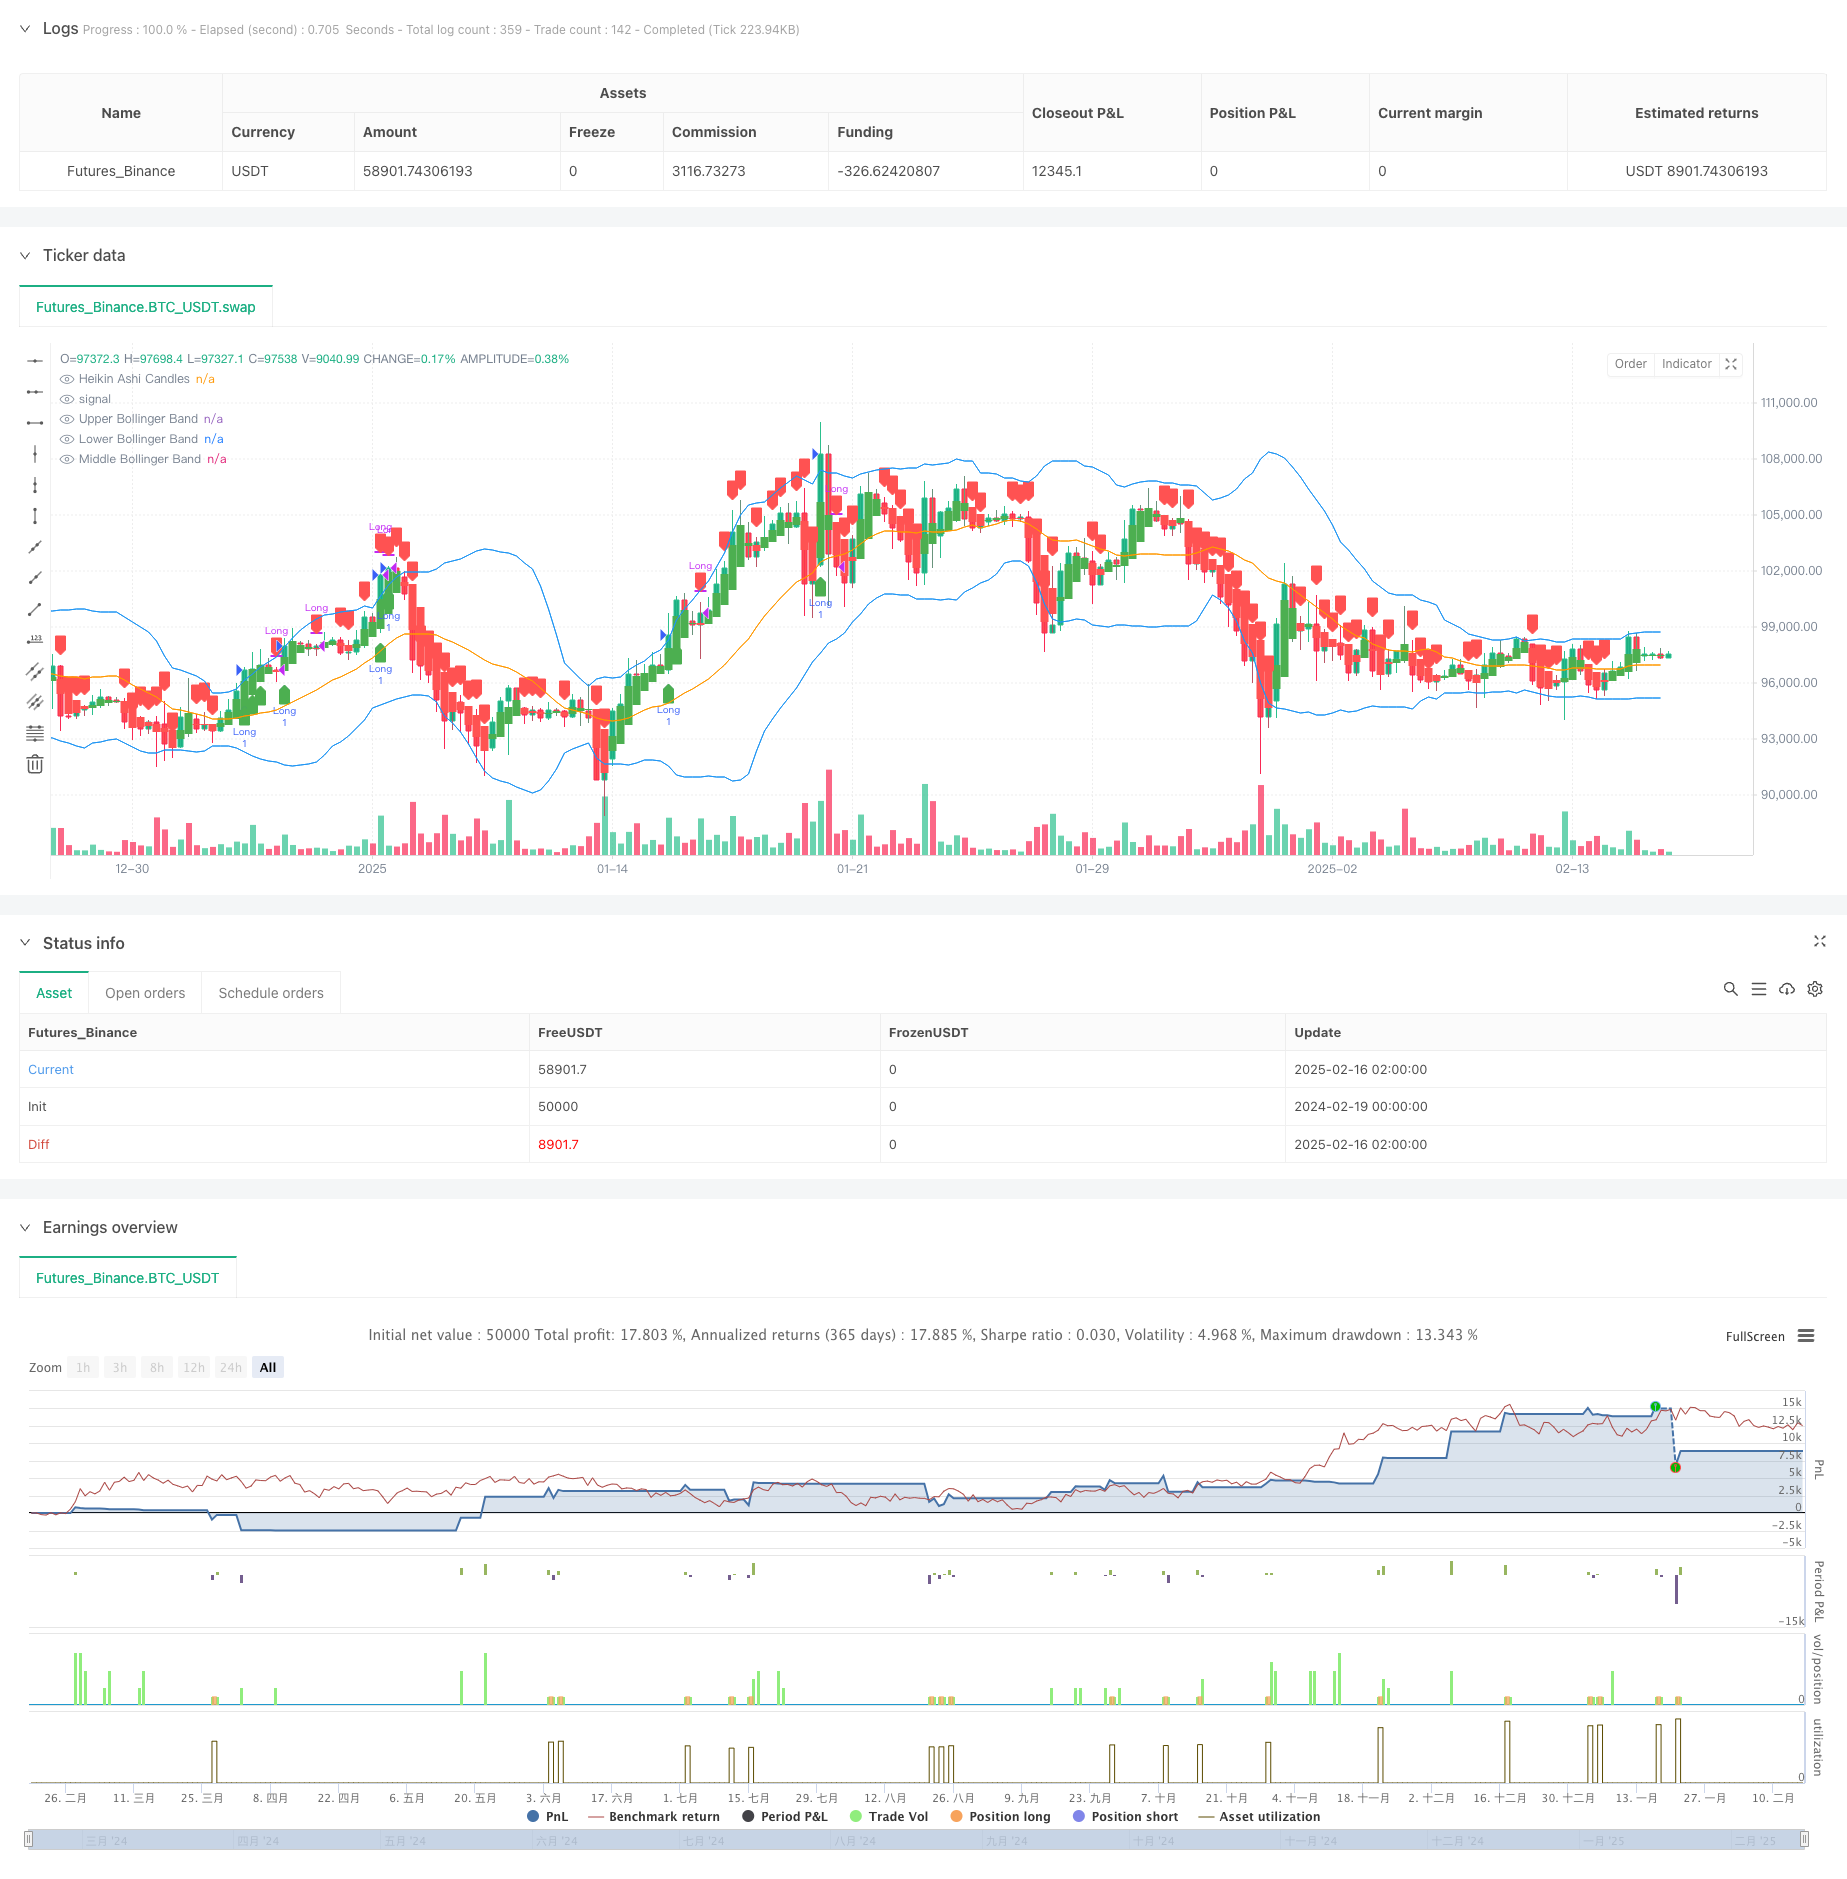
该策略是一个结合布林带(Bollinger Bands)、相对强弱指标(RSI)和平滑K线(Heikin Ashi)的突破交易系统。通过多重技术指标的配合使用,有效过滤市场噪音,捕捉高概率的突破交易机会。策略采用趋势跟踪和动量交易的理念,在突破确认后入场,通过平滑K线的反转和RSI超买作为退出信号。
策略原理
策略的核心逻辑基于以下三个技术指标的协同: 1. 布林带用于识别价格波动范围和潜在突破位置,由20日均线作为中轨,上下轨距离中轨2个标准差。 2. RSI指标用于确认价格动量,采用14周期设置,RSI大于50表示上升动量。 3. 平滑K线通过计算开盘价、最高价、最低价和收盘价的加权平均,过滤短期价格波动。
入场条件需同时满足: - 平滑K线由红转绿 - 收盘价突破布林带上轨 - RSI大于50
退出条件满足以下任一: - 平滑K线由绿转红 - RSI达到70的超买水平
策略优势
- 多重技术指标的配合使用提高了交易信号的可靠性
- 平滑K线有效降低了假突破的影响
- RSI指标的加入确保在趋势方向做多
- 清晰的入场和退出机制,避免主观判断
- 策略逻辑简单,易于理解和执行
- 参数可根据不同市场特征灵活调整
策略风险
- 在震荡市场可能产生频繁的假信号
- 入场条件较为严格,可能错过部分交易机会
- 依赖技术指标可能在市场环境急剧变化时失效
- 未考虑基本面因素对市场的影响
- 退出机制可能导致错过更大的利润空间
风险控制建议: - 设置止损位置保护资金安全 - 根据市场波动调整布林带参数 - 结合更多市场分析维度 - 严格执行交易计划
策略优化方向
- 引入自适应参数:
- 根据市场波动率动态调整布林带乘数
- 基于市场环境优化RSI参数
- 增加过滤条件:
- 加入成交量确认
- 考虑更长期均线趋势
- 纳入市场波动率指标
- 完善止损机制:
- 设计移动止损
- 增加盈亏比控制
- 优化仓位管理方案
- 增强信号系统:
- 开发信号强度评分
- 设计信号确认机制
- 优化出场时机判断
总结
该策略通过布林带、RSI和平滑K线的组合应用,构建了一个相对完整的趋势跟踪交易系统。策略逻辑清晰,执行标准明确,具有较好的实用性。通过优化参数设置和增加辅助指标,策略的稳定性和可靠性有望进一步提升。建议交易者在实盘应用前进行充分的回测验证,并结合市场特征和个人风险偏好做出适当调整。
策略源码
/*backtest
start: 2024-02-19 00:00:00
end: 2025-02-16 08:00:00
period: 6h
basePeriod: 6h
exchanges: [{"eid":"Futures_Binance","currency":"BTC_USDT"}]
*/

//@version=6
strategy("Bollinger Bands + RSI + Heikin Ashi Breakout", overlay=true)

// Input Settings
bbLength = input.int(20, title="Bollinger Bands Length")
bbMultiplier = input.float(2, title="Bollinger Bands Multiplier")
rsiLength = input.int(14, title="RSI Length")
rsiOverbought = input.float(70, title="RSI Overbought Level")

// Bollinger Bands
basis = ta.sma(close, bbLength)
dev = bbMultiplier * ta.stdev(close, bbLength)
upperBB = basis + dev
lowerBB = basis - dev

// Heikin Ashi Candle Calculations
var float heikinOpen = na  // Declare `heikinOpen` with an undefined initial value
var float heikinClose = na // Declare `heikinClose` with an undefined initial value

// Update Heikin Ashi values
heikinClose := (open + high + low + close) / 4
heikinOpen := na(heikinOpen[1]) ? (open + close) / 2 : (heikinOpen[1] + heikinClose[1]) / 2
heikinHigh = math.max(high, math.max(heikinOpen, heikinClose))
heikinLow = math.min(low, math.min(heikinOpen, heikinClose))

// RSI
rsi = ta.rsi(close, rsiLength)

// Entry Conditions
heikinGreen = heikinClose > heikinOpen
longCondition = heikinGreen and close > upperBB and rsi > 50

// Exit Conditions
heikinRed = heikinClose < heikinOpen
longExitCondition = heikinRed or rsi >= rsiOverbought

// Strategy Execution
if (longCondition)
    strategy.entry("Long", strategy.long)

if (longExitCondition)
    strategy.close("Long", comment="Exit Long")

// Plotting Bollinger Bands
plot(upperBB, color=color.blue, title="Upper Bollinger Band")
plot(lowerBB, color=color.blue, title="Lower Bollinger Band")
plot(basis, color=color.orange, title="Middle Bollinger Band")

// Heikin Ashi Visualization
plotcandle(heikinOpen, heikinHigh, heikinLow, heikinClose, color=(heikinGreen ? color.green : color.red), title="Heikin Ashi Candles")

// Debugging Signals
plotshape(longCondition, style=shape.labelup, location=location.belowbar, color=color.green, title="Long Entry Signal")
plotshape(longExitCondition, style=shape.labeldown, location=location.abovebar, color=color.red, title="Long Exit Signal")
相关推荐