চলমান গড় ক্রসওভার কৌশল

ওভারভিউ
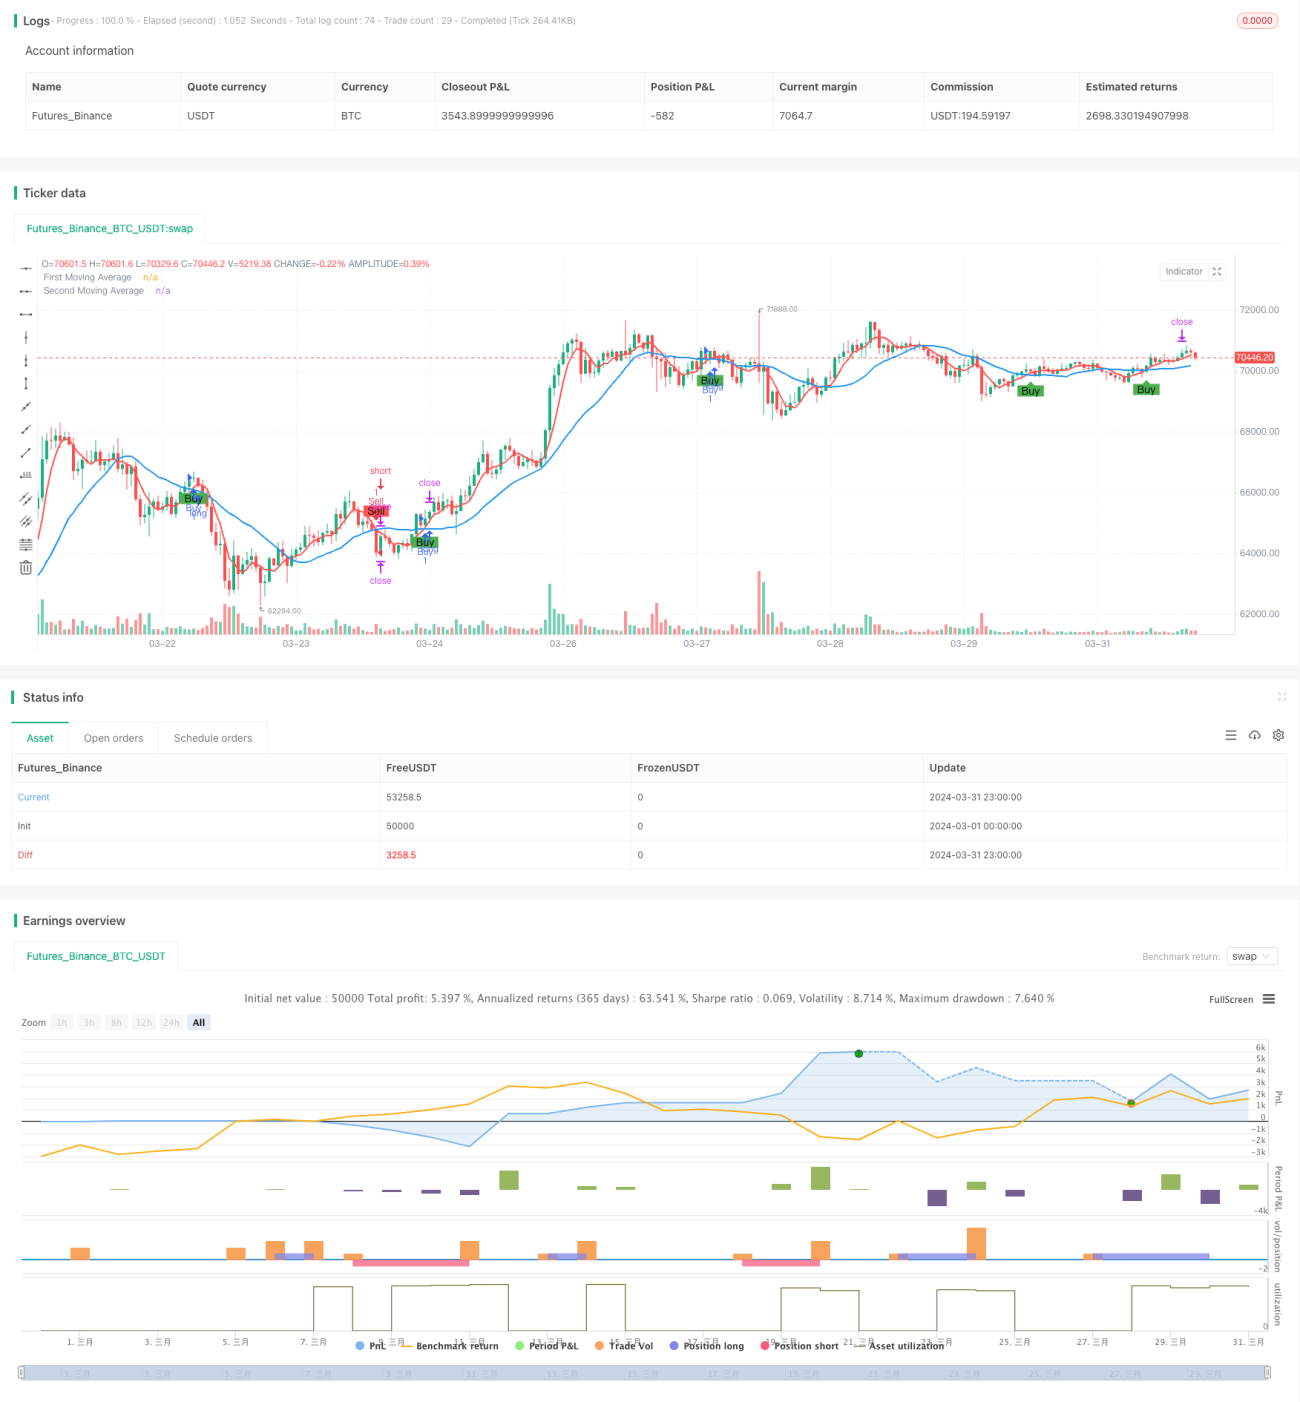
এই কৌশলটি দুটি মুভিং এভারেজ ((MA) ব্যবহার করে ট্রেডিং সিগন্যাল তৈরি করে। যখন সংক্ষিপ্ত সময়ের MA নীচে থেকে উপরে দীর্ঘ সময়ের MA অতিক্রম করে, তখন এটি একটি কেনার সংকেত তৈরি করে; যখন সংক্ষিপ্ত সময়ের MA উপরে থেকে নীচে দীর্ঘ সময়ের MA অতিক্রম করে, তখন এটি একটি বিক্রয় সংকেত তৈরি করে। এই কৌশলটি একই সাথে ট্রেডিং সময়কাল ((8 থেকে 20 UTC) এবং স্টপ পয়েন্ট ((150 পয়েন্ট) সেট করে।
কৌশল নীতি
- দুটি ভিন্ন সময়ের চলমান গড় গণনা করুন (ডিফল্ট 5 এবং 20 বার) ।
- সংক্ষিপ্ত মেয়াদী এমএ দ্বারা দীর্ঘ মেয়াদী এমএ এর উপরে/নিচে প্রবাহিত হয় কিনা তা বিচার করুন, এটি কেনার/বিক্রয়ের সংকেত হিসাবে ব্যবহার করুন।
- ট্রেডিং সময়সীমা সেট করুন ৮ঃ০০ থেকে ২০ঃ০০ ইউটিসি সময়, শুধুমাত্র এই সময়ের মধ্যে ট্রেড করুন।
- প্রবণতা নিশ্চিত করার জন্য চারটি সাম্প্রতিক K লাইন MA এর উপরে/নিচে বন্ধ হয়েছে কিনা তা বিচার করুন।
- যদি আপনি ক্রয়/বিক্রয় শর্ত পূরণ করেন, তাহলে আপনি পজিশন খুলুন এবং ১৫০ পয়েন্টের স্টপ সেট করুন।
কৌশলগত সুবিধা
- দুটি ভিন্ন পিরিয়ডের এমএ ব্যবহার করলে ট্রেন্ডিং মার্কেটে প্রবণতাকে কার্যকরভাবে ধরা যায়।
- ট্রেডিংয়ের সময়সীমা নির্ধারণ করলে কম তরলতার সময় ট্রেড করা এড়ানো যায় এবং ঝুঁকি কমাতে পারে।
- সাম্প্রতিক চারটি K-লাইন MA-এর উপরে/নিচে বন্ধ হয়েছে কিনা তা বিচার করে ট্রেন্ডিং নিশ্চিত করা যায়, যার ফলে সিগন্যালের নির্ভরযোগ্যতা বাড়ায়।
- ফিক্সড স্টপ পয়েন্ট সেট করুন, যাতে আপনি লাভের উপর কার্যকরভাবে লক করতে পারেন এবং ঝুঁকি নিয়ন্ত্রণ করতে পারেন।
কৌশলগত ঝুঁকি
- এই কৌশলটি বাজারের অস্থিরতার সময় ঘন ঘন ভুল সংকেত দিতে পারে এবং ক্ষতির কারণ হতে পারে।
- ফিক্সড স্টপ পয়েন্টগুলি কৌশলটির লাভের সুযোগকে সীমাবদ্ধ করতে পারে।
- এই ব্যবস্থায় কোন স্টপ লস সেট করা নেই, যা দ্রুত বিপরীতমুখী ট্রেডিংয়ের ক্ষেত্রে ঝুঁকিপূর্ণ।
কৌশল অপ্টিমাইজেশনের দিকনির্দেশনা
- সিগন্যালের নির্ভরযোগ্যতা বাড়ানোর জন্য আরএসআই, এমএসিডি ইত্যাদির মতো আরও প্রযুক্তিগত সূচক প্রবর্তন করা যেতে পারে।
- স্টপস্টপ ক্ষতির সেটিংগুলি অনুকূলিতকরণ করা যেতে পারে, যেমন ডায়নামিক স্টপস্টপ বা এটিআর-ভিত্তিক স্টপস্টপ ক্ষতি।
- ট্রেডিং সিগন্যালের দ্বিতীয় নিশ্চিতকরণের জন্য, মার্কেট মাইক্রোস্ট্রাকচারের তথ্য যেমন অর্ডার ফ্লো ব্যবহার করা যেতে পারে।
- বিভিন্ন বাজার অবস্থার জন্য বিভিন্ন প্যারামিটার সেট করা যেতে পারে (ট্রেন্ড/অস্থিরতা) যা কৌশলটির অভিযোজনযোগ্যতা বাড়ায়।
সারসংক্ষেপ
এই কৌশলটি ট্রেডিং সিগন্যাল উত্পন্ন করার জন্য দুটি ভিন্ন চক্রের চলমান গড়ের ক্রস উপর ভিত্তি করে ট্রেন্ডিং বাজারের জন্য প্রযোজ্য। ট্রেডিং সময়কাল এবং একটি নির্দিষ্ট স্টপ-আপ সেট করে কিছুটা ঝুঁকি নিয়ন্ত্রণ করা যেতে পারে। তবে এই কৌশলটি অস্থির বাজারে খারাপ পারফরম্যান্স করতে পারে এবং একটি নির্দিষ্ট স্টপ-আপ কৌশলটির লাভের স্থানকে সীমাবদ্ধ করতে পারে। ভবিষ্যতে আরও প্রযুক্তিগত সূচকগুলি প্রবর্তন করা, স্টপ-আপ সেটিংগুলিকে অনুকূলিত করা, বাজারের মাইক্রোস্ট্রাকচার সম্পর্কিত তথ্য এবং বাজারের বিভিন্ন অবস্থার জন্য বিভিন্ন প্যারামিটার সেটিংগুলি গ্রহণ করা ইত্যাদির মাধ্যমে কৌশলটি অনুকূলিত করার জন্য বিবেচনা করা যেতে পারে।
- 1