Strategie für einen doppelten gleitenden Durchschnitt mit mehreren Symbolen (Teaching)
Schriftsteller:- Ich bin ein Idiot., Erstellt: 2022-04-07 16:14:35, Aktualisiert: 2022-04-08 09:13:58Strategie für einen doppelten gleitenden Durchschnitt mit mehreren Symbolen (Teaching)
Auf Anfrage unserer Benutzer in den Foren, dass sie eine Multi-Symbol-Doppel-Durchschnitts-Strategie als Designreferenz haben möchten, wird eine Multi-Symbol-Doppel-Durchschnitts-Strategie in der heutigen Freigabe implementiert.
Strategisches Denken
Die Logik der doppelten gleitenden Durchschnittsstrategie ist sehr einfach, d.h. zwei gleitende Durchschnitte. Ein gleitender Durchschnitt mit einer kleinen Periode (schnelle Linie) und ein gleitender Durchschnittswert mit einer großen Periode (langsamer Linie). Wenn die beiden Linien ein goldenes Kreuz haben (die schnelle Linie überquert die langsame Linie von unten), kaufen Sie lang und wenn die beiden Linien ein totes Kreuz haben (die schnelle Linie überquert die langsame Linie von oben), verkaufen Sie kurz. Für den gleitenden Durchschnitt verwenden wir EMA.
Es ist nur so, dass die Strategie für mehrere Symbole konzipiert werden muss, so dass die Parameter verschiedener Symbole unterschiedlich sein können (verschiedene Symbole verwenden unterschiedliche gleitende Durchschnittsparameter), so dass es notwendig ist, Parameter in einem
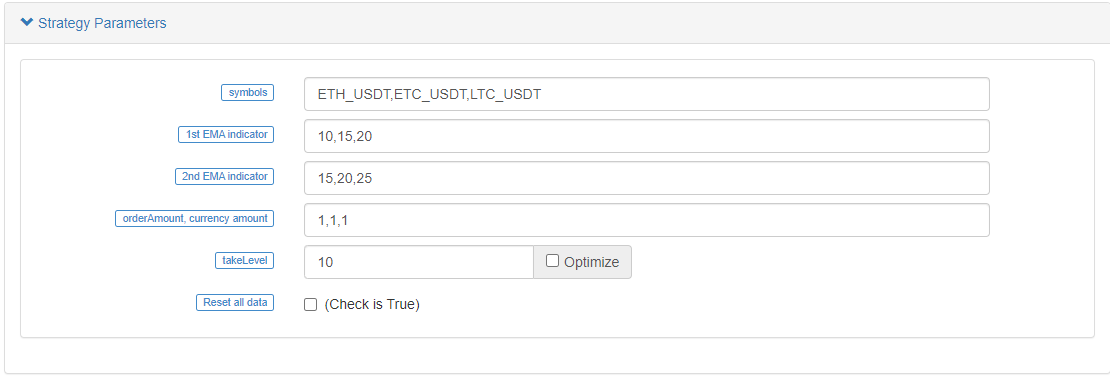
Die Parameter sind in Form einer Zeichenfolge, wobei jeder Parameter durch ein Komma getrennt ist, entworfen. Diese Zeichenfolge werden analysiert, wenn die Strategie ausläuft, die mit der Ausführungslogik für jedes Symbol (Handelspaar) abgestimmt wird. Strategie-Umfrage erkennt die Marktkurse aller Symbole, den Auslöser der Handelsbedingungen und den Chartdruck. Nachdem alle Symbole einmal befragt wurden, werden die Daten aggregiert und die Tabelleninformationen werden in der Statusleiste angezeigt.
Die Strategie ist super einfach gestaltet und sehr für Anfänger geeignet; sie umfasst insgesamt nur mehr als 200 Zeilen.
Strategie-Code
// function effect: to cancel all pending orders of the current trading pair
function cancelAll(e) {
while (true) {
var orders = _C(e.GetOrders)
if (orders.length == 0) {
break
} else {
for (var i = 0 ; i < orders.length ; i++) {
e.CancelOrder(orders[i].Id, orders[i])
Sleep(500)
}
}
Sleep(500)
}
}
// function effect: to calculate the real-time profit and loss
function getProfit(account, initAccount, lastPrices) {
// account indicates the current account information; initAccount is the initial account information; lastPrices is the the latest prices of all current symbols
var sum = 0
_.each(account, function(val, key) {
// traverse the current total assets, and calculate asset currency (except USDT) difference and amount difference
if (key != "USDT" && typeof(initAccount[key]) == "number" && lastPrices[key + "_USDT"]) {
sum += (account[key] - initAccount[key]) * lastPrices[key + "_USDT"]
}
})
// return the asset profit and loss calculated by the current price
return account["USDT"] - initAccount["USDT"] + sum
}
// function effect: to generate chart configuration
function createChartConfig(symbol, ema1Period, ema2Period) {
// symbol indicates trading pair; ema1Period indicates the first EMA period; ema2Period indicates the second EMA period
var chart = {
__isStock: true,
extension: {
layout: 'single',
height: 600,
},
title : { text : symbol},
xAxis: { type: 'datetime'},
series : [
{
type: 'candlestick', // K-line date series
name: symbol,
id: symbol,
data: []
}, {
type: 'line', // EMA data series
name: symbol + ',EMA1:' + ema1Period,
data: [],
}, {
type: 'line', // EMA data series
name: symbol + ',EMA2:' + ema2Period,
data: []
}
]
}
return chart
}
function main() {
// reset all data
if (isReset) {
_G(null) // vacuum all persistently recorded data
LogReset(1) // vacuum all logs
LogProfitReset() // vacuum all profit logs
LogVacuum() // release the resource occupied by the bot database
Log("reset all data", "#FF0000") // print information
}
// parse parameters
var arrSymbols = symbols.split(",") // use comma to split the trading symbol strings
var arrEma1Periods = ema1Periods.split(",") // split the string of the first EMA parameter
var arrEma2Periods = ema2Periods.split(",") // split the string of the second EMA parameter
var arrAmounts = orderAmounts.split(",") // split the order amount of each symbol
var account = {} // the variable used to record the current asset information
var initAccount = {} // the variable used to record the initial asset information
var currTradeMsg = {} // the variable used to record whether the current BAR is executed
var lastPrices = {} // the variable used to record the latest price of the monitored symbol
var lastBarTime = {} // the variable used to record the time of the latest BAR, to judge the BAR update during plotting
var arrChartConfig = [] // the variable used to record the chart configuration information, to plot
if (_G("currTradeMsg")) { // for example, when restart, recover currTradeMsg data
currTradeMsg = _G("currTradeMsg")
Log("recover GetRecords", currTradeMsg)
}
// initialize account
_.each(arrSymbols, function(symbol, index) {
exchange.SetCurrency(symbol)
var arrCurrencyName = symbol.split("_")
var baseCurrency = arrCurrencyName[0]
var quoteCurrency = arrCurrencyName[1]
if (quoteCurrency != "USDT") {
throw "only support quoteCurrency: USDT"
}
if (!account[baseCurrency] || !account[quoteCurrency]) {
cancelAll(exchange)
var acc = _C(exchange.GetAccount)
account[baseCurrency] = acc.Stocks
account[quoteCurrency] = acc.Balance
}
// initialize the related data of chart
lastBarTime[symbol] = 0
arrChartConfig.push(createChartConfig(symbol, arrEma1Periods[index], arrEma2Periods[index]))
})
if (_G("initAccount")) {
initAccount = _G("initAccount")
Log("recover initial account information", initAccount)
} else {
// use the current asset information to initialize initAccount (variable)
_.each(account, function(val, key) {
initAccount[key] = val
})
}
Log("account:", account, "initAccount:", initAccount) // print asset information
// initialize the chart objects
var chart = Chart(arrChartConfig)
// reset chart
chart.reset()
// strategy logic of the main loop
while (true) {
// traverse all symbols, and execute the dual moving average logic one by one
_.each(arrSymbols, function(symbol, index) {
exchange.SetCurrency(symbol) // switch the trading pair to the trading pair recorded by by symbol string
var arrCurrencyName = symbol.split("_") // split trading pairs by "_"
var baseCurrency = arrCurrencyName[0] // string of base currency
var quoteCurrency = arrCurrencyName[1] // string of quote currency
// according to index, obtain the EMA paramater of the current trading pair
var ema1Period = parseFloat(arrEma1Periods[index])
var ema2Period = parseFloat(arrEma2Periods[index])
var amount = parseFloat(arrAmounts[index])
// obtain the K-line data of the current trading pair
var r = exchange.GetRecords()
if (!r || r.length < Math.max(ema1Period, ema2Period)) { // when the length of K-line is not long enough, return directly
Sleep(1000)
return
}
var currBarTime = r[r.length - 1].Time // record the current BAR timestamp
lastPrices[symbol] = r[r.length - 1].Close // record the current latest price
var ema1 = TA.EMA(r, ema1Period) // calculate EMA indicator
var ema2 = TA.EMA(r, ema2Period) // calculate EMA indicator
if (ema1.length < 3 || ema2.length < 3) { // when the length of EMA indicator array is too short, return derectly
Sleep(1000)
return
}
var ema1Last2 = ema1[ema1.length - 2] // EMA on the second last BAR
var ema1Last3 = ema1[ema1.length - 3] // EMA on the third last BAR
var ema2Last2 = ema2[ema2.length - 2]
var ema2Last3 = ema2[ema2.length - 3]
// write the chart data
var klineIndex = index + 2 * index
// traverse k-line data
for (var i = 0 ; i < r.length ; i++) {
if (r[i].Time == lastBarTime[symbol]) { // plot; update the current BAR and its indicator
// update
chart.add(klineIndex, [r[i].Time, r[i].Open, r[i].High, r[i].Low, r[i].Close], -1)
chart.add(klineIndex + 1, [r[i].Time, ema1[i]], -1)
chart.add(klineIndex + 2, [r[i].Time, ema2[i]], -1)
} else if (r[i].Time > lastBarTime[symbol]) { // plot; add BAR and its indicator
// add
lastBarTime[symbol] = r[i].Time // update the timestamp
chart.add(klineIndex, [r[i].Time, r[i].Open, r[i].High, r[i].Low, r[i].Close])
chart.add(klineIndex + 1, [r[i].Time, ema1[i]])
chart.add(klineIndex + 2, [r[i].Time, ema2[i]])
}
}
if (ema1Last3 < ema2Last3 && ema1Last2 > ema2Last2 && currTradeMsg[symbol] != currBarTime) {
// golden cross
var depth = exchange.GetDepth() // obtain the depth data of the current order book
var price = depth.Asks[Math.min(takeLevel, depth.Asks.length)].Price // select the 10th level price; taker
if (depth && price * amount <= account[quoteCurrency]) { // obtain that the depth data is normal, and the assets are enough to place an order
exchange.Buy(price, amount, ema1Last3, ema2Last3, ema1Last2, ema2Last2) // maker; buy
cancelAll(exchange) // cancel all pending orders
var acc = _C(exchange.GetAccount) // obtain the account asset information
if (acc.Stocks != account[baseCurrency]) { // detect the account assets changed
account[baseCurrency] = acc.Stocks // update assets
account[quoteCurrency] = acc.Balance // update assets
currTradeMsg[symbol] = currBarTime // record the current BAR has been executed
_G("currTradeMsg", currTradeMsg) // persistently record
var profit = getProfit(account, initAccount, lastPrices) // calculate profit
if (profit) {
LogProfit(profit, account, initAccount) // print profit
}
}
}
} else if (ema1Last3 > ema2Last3 && ema1Last2 < ema2Last2 && currTradeMsg[symbol] != currBarTime) {
// death cross
var depth = exchange.GetDepth()
var price = depth.Bids[Math.min(takeLevel, depth.Bids.length)].Price
if (depth && amount <= account[baseCurrency]) {
exchange.Sell(price, amount, ema1Last3, ema2Last3, ema1Last2, ema2Last2)
cancelAll(exchange)
var acc = _C(exchange.GetAccount)
if (acc.Stocks != account[baseCurrency]) {
account[baseCurrency] = acc.Stocks
account[quoteCurrency] = acc.Balance
currTradeMsg[symbol] = currBarTime
_G("currTradeMsg", currTradeMsg)
var profit = getProfit(account, initAccount, lastPrices)
if (profit) {
LogProfit(profit, account, initAccount)
}
}
}
}
Sleep(1000)
})
// variables in the table of status bar
var tbl = {
type : "table",
title : "account information",
cols : [],
rows : []
}
// write the data in the table structure of status bar
tbl.cols.push("--")
tbl.rows.push(["initial"])
tbl.rows.push(["current"])
_.each(account, function(val, key) {
if (typeof(initAccount[key]) == "number") {
tbl.cols.push(key)
tbl.rows[0].push(initAccount[key]) // initial
tbl.rows[1].push(val) // current
}
})
// display the status bar table
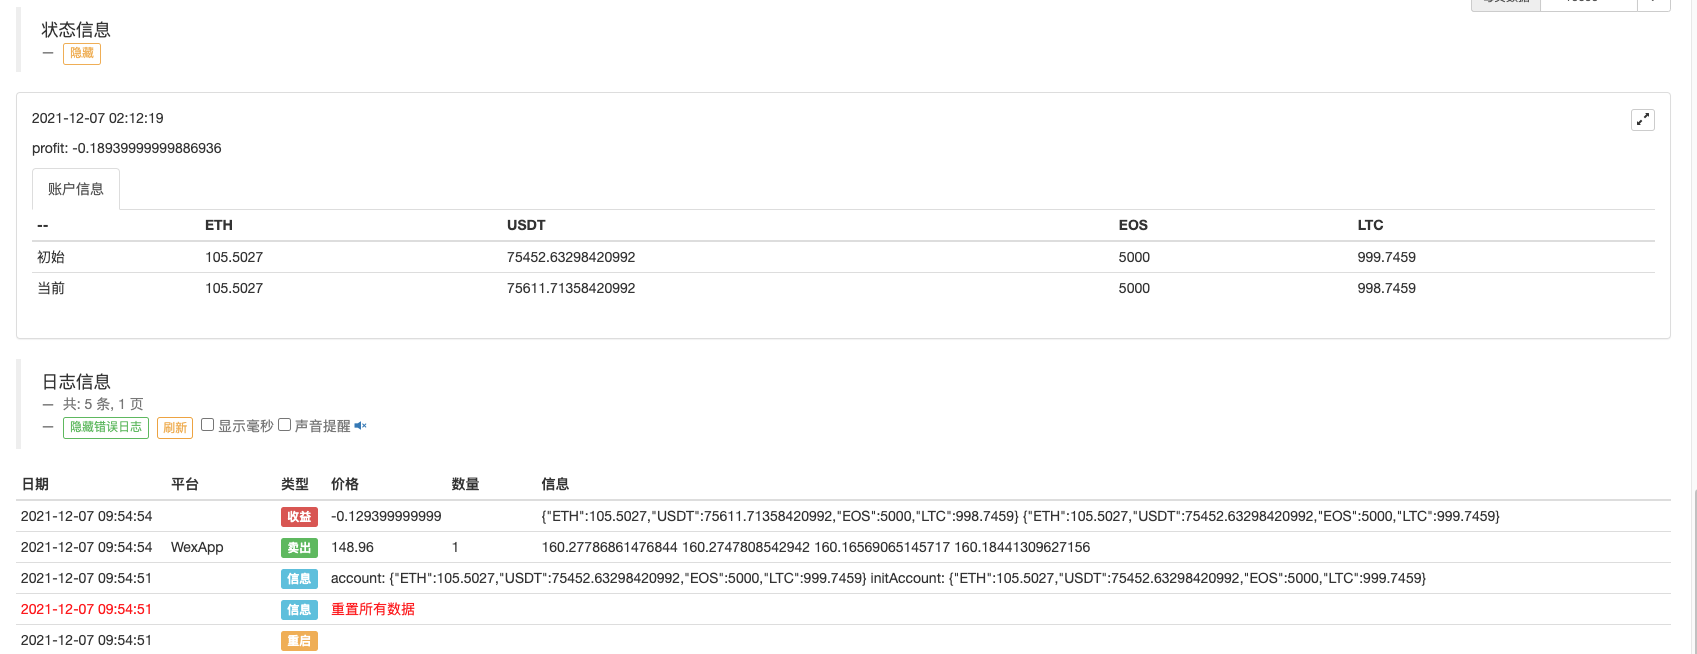
LogStatus(_D(), "\n", "profit:", getProfit(account, initAccount, lastPrices), "\n", "`" + JSON.stringify(tbl) + "`")
}
}
Strategie-Backtest
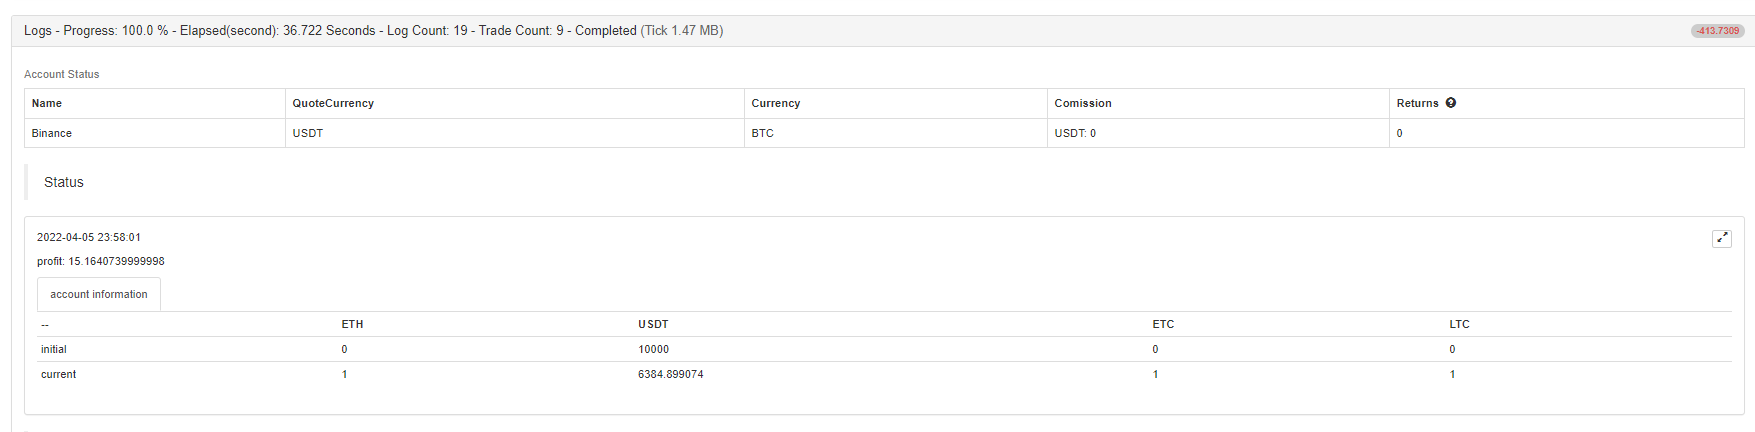
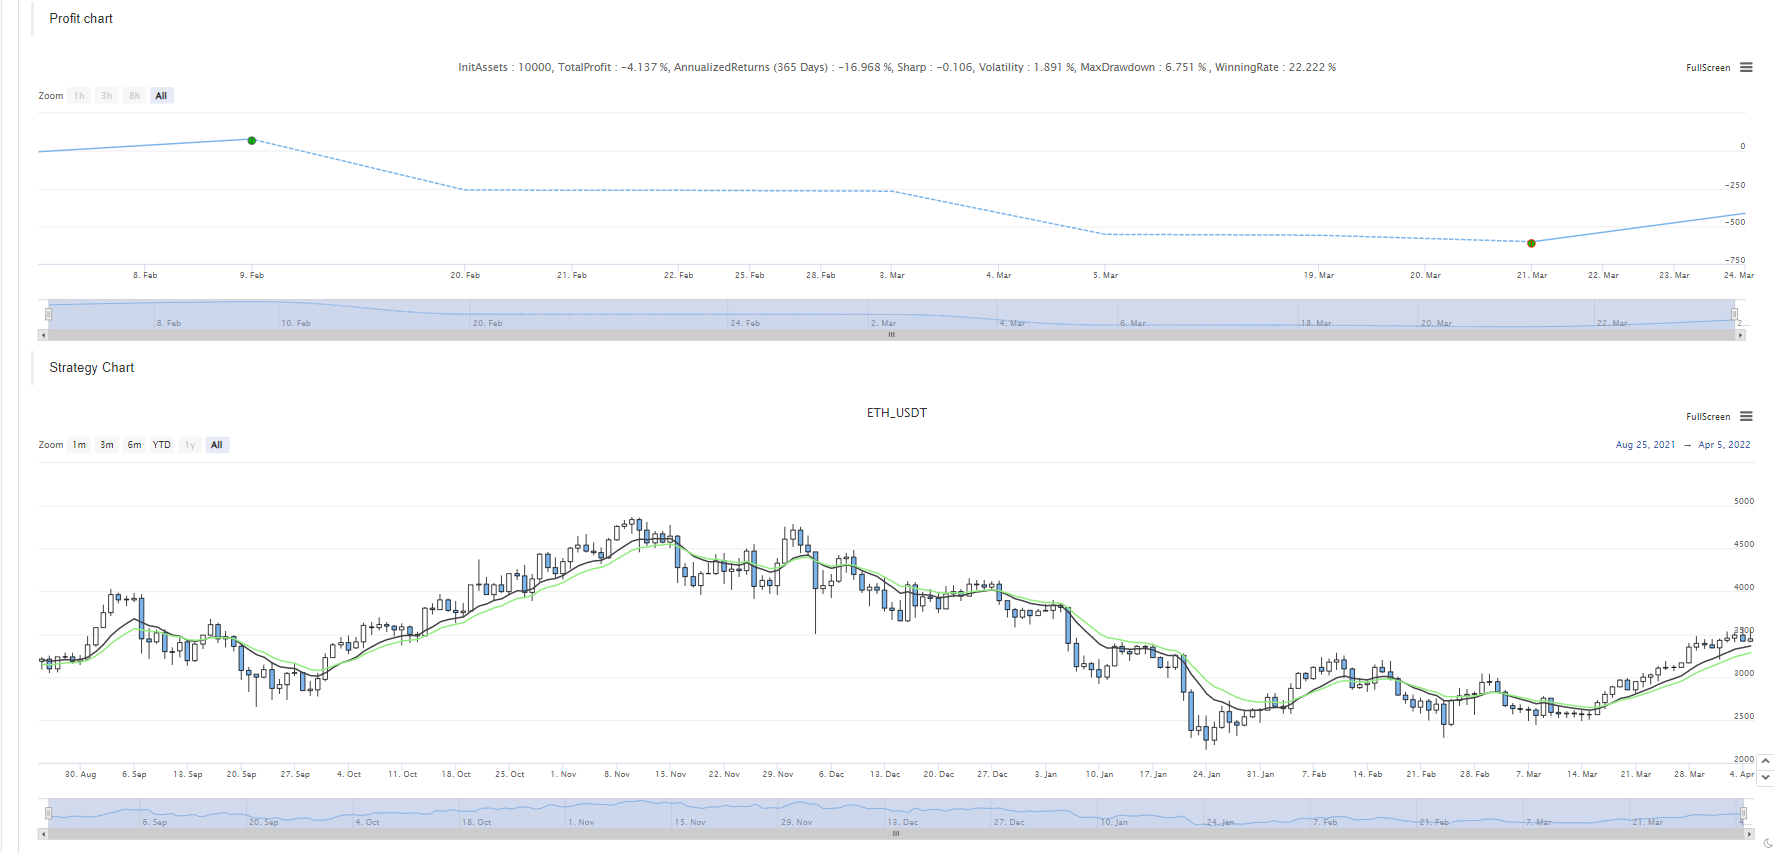
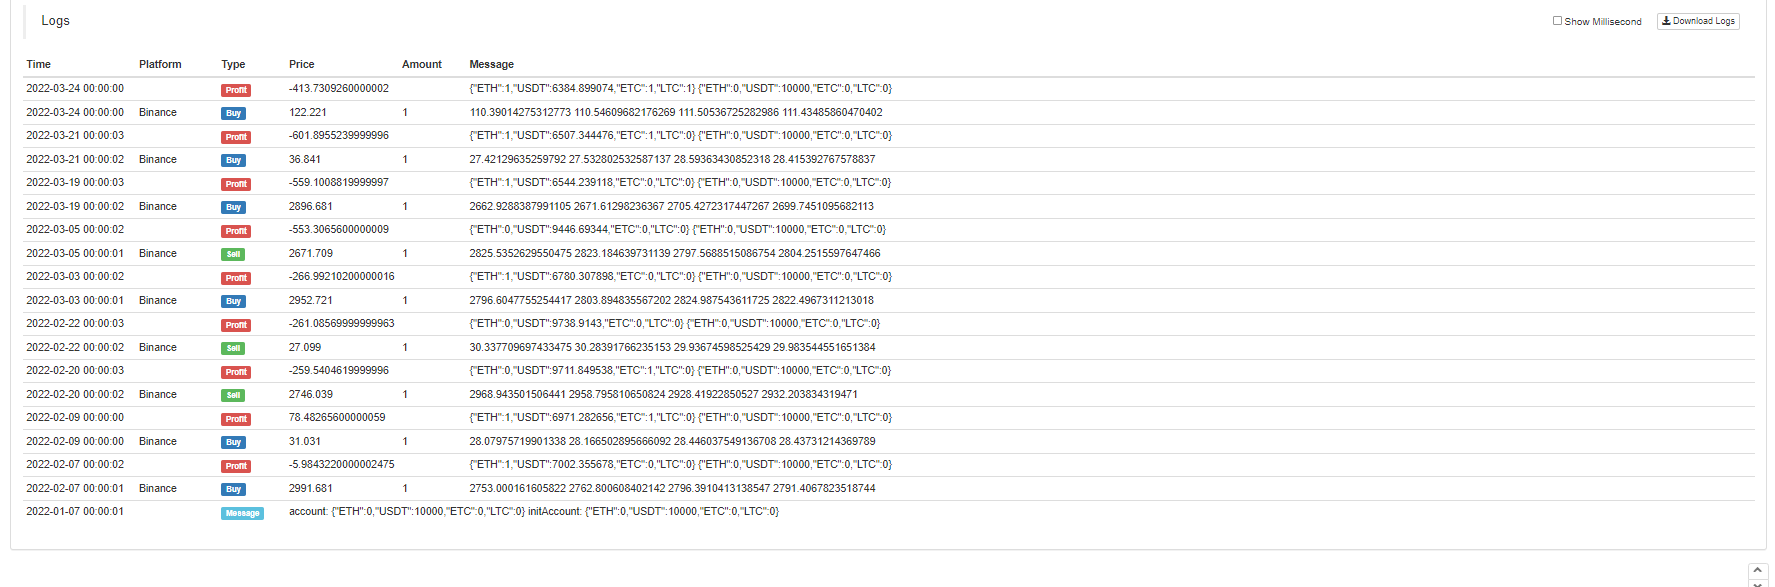
Sie können sehen, dass ETH, LTC und ETC alle Trades nach den Auslösern des goldenen Kreuzes und des Todeskreuzes der gleitenden Durchschnitte hatten.
Sie können auch auf simulierten Bot warten, um zu testen.
Strategie-Quellcode:https://www.fmz.com/strategy/333783
Die Strategie wird nur für Backtest und Strategie-Design-Lernen verwendet, also verwenden Sie sie in einem Bot mit Vorsicht.
- Eine Plattform, die auf FMZ basiert.
- Kryptowährungs-Kontrakt einfacher Auftragsüberwachungsbot
- Wenn Sie mit getdepth die entsprechende Zeitschrift erhalten möchten
- Ignoriert, gelöst
- Die Frage nach dem Gesichtswert
- dYdX-Strategie-Entwurfsbeispiel
- Erste Erforschung der Anwendung von Python Crawler auf FMZ
Crawling Binance Ankündigungsinhalt - Hedge-Strategie-Design-Forschung & Beispiel für offene Spot- und Futures-Orders
- Aktuelle Situation und empfohlene Anwendung der Finanzierungsrate-Strategie
- Strategie für einen doppelten gleitenden Durchschnitts-Brechpunkt von Kryptowährungs-Futures (Teaching)
- Realisierung von Fisher Indicator in JavaScript und Plotting auf FMZ
- Treuhänder
- 2021 Kryptowährungs-TAQ-Überprüfung & Einfachste verpasste Strategie der 10-fachen Erhöhung
- Kryptowährungs-Futures Multi-Symbol ART-Strategie (Lehre)
- Aktualisieren! Kryptowährungs Futures Martingale Strategie
- Die Getrecords-Funktion kann keine K-Stringkarte in Sekunden erhalten
- Konstruktion eines FMZ-basierten Auftragsmanagementsystems (2)
- Die Volumen-Daten, die Getticker zurückgegeben hat, sind falsch.
- Gestaltung eines FMZ-basierten Auftragssynchronmanagementsystems (1)
- Entwerfen Sie eine Bibliothek mit mehreren Diagrammen