Anfänger, schauen Sie sich das an Ich bringe Sie zum Quantitative Trading mit Kryptowährungen (7)
Schriftsteller:- Ich bin ein Idiot., Erstellt: 2022-04-22 11:59:32, Aktualisiert: 2022-04-22 12:01:11Anfänger, schauen Sie sich das an Ich bringe Sie zum Quantitative Trading mit Kryptowährungen (7)
Im letzten Artikel haben wir gemeinsam eine einfache Multi-Symbol-Gitterstrategie entwickelt. Als nächstes werden wir weiter lernen und auf dem Weg des quantitativen Handels voranschreiten. In diesem Artikel werden wir ein komplizierteres Strategiedesign - das Design der Hedge-Strategie - diskutieren. Der Artikel plant, eine Multi-Symbol-Kreuzzeit-Hedge-Strategie zu entwerfen. Wenn es um die Kreuzzeit-Hedge-Strategie geht, müssen diejenigen, die mit Futures-Handel vertraut sind, damit vertraut sein. Für Anfänger verstehen Sie diese Konzepte möglicherweise nicht, also erklären wir kurz die Konzepte über die Kreuzzeit-Hedge.
Zwischenzeitliche Hecke
Im Allgemeinen besteht bei der Querschnittssicherung ein Long- und ein Short-Kontrakt und es werden drei Situationen (Long und Short) erwartet, in denen die Positionen gleichzeitig geschlossen werden:
- Wenn Long profitabel ist, hat Short einen Verlust, und der Gewinn ist mehr als der Verlust, schließen Positionen; es wird eine Rendite geben, nachdem der Gewinn den Verlust deckt.
- Wenn Short profitabel ist, hat Long einen Verlust, und der Gewinn ist größer als der Verlust, schließen Positionen; Es wird eine Rendite geben, nachdem der Gewinn den Verlust deckt. (ähnlich)
- Wenn es profitabel ist, Long zu machen, und wenn es auch profitabel ist, Short zu machen, zögern Sie nicht, Positionen zu schließen!
Für andere Situationen, in denen es schwebende Verluste gibt, können Sie mehr Positionen halten oder weiter hinzufügen. (weil die Spreadfluktuation geringer ist als die einseitige Fluktuation, wird das Risiko geringer sein, aber beachten Sie, dass dies nur vergleichend ist!)
Set A1 as the price of contract A at the time 1, and set B1 as the price of contract B at the time 1. At the time, do short in contract A, at A1; do long in contract B, at B1.
Set A2 as the price of contract A at the time 2, and set B2 as the price of contract B at the time 2. At the time, close positions (close short) of contract A, at A2; close positions (close long) of contract B, at B2.

Spread at time 1: A1 - B1 = X
Spread at time 2: A2 - B2 = Y
X - Y = A1 - B1 - (A2 - B2)
X - Y = A1 - B1 - A2 + B2
X - Y = A1 - A2 + B2 - B1

As you can see, "A1 - A2 " is the profit spread of closing position in contract A.
"B2 - B1" is the profit spread of closing position in contract B. It is profitable, as long as the closing postion spread of the two contracts is a positive number, namely A1 - A2 + B2 - B1 > 0. That is to say as long as X - Y > 0,
for: X - Y = A1 - A2 + B2 - B1

It is concluded that as long as the spread X when opening a position is greater than the spread Y when closing a position, it is profitable (note that it is making short in contract A and making long in contract B to open a position; if the situation is reversed, the result will be opposite). Of course, this is just theoretical, and factors such as the handling fee and slippoint should also be considered in practice.
Da Kryptowährungsplattformen sowohl Lieferverträge als auch Dauerverträge haben. Und der Preis von Dauerverträgen ist aufgrund der Finanzierungskurs immer nahe am Spotpreis. Dann wählen wir Lieferverträge und Dauerverträge, um Absicherung und Arbitrage durchzuführen. Für den Liefervertrag können wir einen mit einem vergleichsweise langen Zeitraum wählen, so dass der Absicherungsvertrag nicht häufig festgelegt werden muss.
Erwärmen Sie sich durch einige Multi-Symbol-Spread-Statistiken
Nachdem Sie mit dem Grundprinzip vertraut sind, müssen Sie sich nicht beeilen, die Strategie zu schreiben. Zuerst machen Sie Spread-Statistiken, Plot-Charts und beobachten Sie die Spreads. Wir entwerfen es basierend aufOKEX-Vertrag. Es ist sehr einfach, auf FMZ zu zeichnen, und Sie müssen nur die eingekapselte Funktion mit der Diagrammbibliothek verwendenHochkarten. Die Beschreibung der Plotungsfunktion in der API-Dokumentation:https://www.fmz.com/api#chart..- Ich weiß. Da es sich um eine Multi-Symbol-Strategie handelt, ist es zunächst notwendig, den Preis-Spread dieser Symbole zu bestimmen, bevor man sie zeichnet.
var arrSwapContractType = ["BTC-USDT-SWAP", "LTC-USDT-SWAP", "ETH-USDT-SWAP", "ETC-USDT-SWAP"]   // perpetual contract
var arrDeliveryContractType = ["BTC-USDT-210924", "LTC-USDT-210924", "ETH-USDT-210924", "ETC-USDT-210924"]  // delivery contract
Die Chartkonfiguration kann nicht in einer unendlichen Schleife geschrieben werden, da Sie nicht wissen, welches Symbol zu verwenden ist und wie viele Symbole zu verwenden sind (die nach den Werten arrDeliveryContractType und arrSwapContractType bestimmt werden), so dass die Chartkonfiguration durch eine Funktion zurückgegeben wird.
function createCfg(symbol) {
    var cfg = {
        extension: {
            // it is not part of the group, and is individually displayed; the default is 'group'
            layout: 'single',
            // the specified height, which can be set as string; "300px", which means it will be replaced by "300px" automatically through setting a value of 300
            height: 300,
            // the occupied unit value of the specified width, with a total value of 12
            col: 6
        },
        title: {
            text: symbol
        },
        xAxis: {
            type: 'datetime'
        },
        series: [{
            name: 'plus',
            data: []
        }]
    }

    return cfg
}

function main() {
    // declare arrCfg
    var arrCfg = []                                    // declare an array to store the chart configuration information
    _.each(arrSwapContractType, function(ct) {         // iteratively record the array of perpetual contract codes, pass the "XXX-USDT" part of the contract name as a parameter to the "createCfg" function, construct the chart configuration information, and return
        arrCfg.push(createCfg(formatSymbol(ct)[0]))    // the chart configuration information "push" returned by "createCfg" is in the "arrCfg" array
    })
    var objCharts = Chart(arrCfg)                      // call the function Chart on FMZ platform, and create a chart controlled object called objCharts
    objCharts.reset()                                  // initialize the chart content

    // the rest is omitted...
}
Wir werden die Daten erstellen; wir verwenden die aggregierte Marktschnittstelle des OKEX-Vertrags:
USDT-Perpetualvertrag:
https://www.okex.com/api/v5/market/tickers?instType=SWAP
USDT-Liefervertrag:
https://www.okex.com/api/v5/market/tickers?instType=FUTURES
Hier schreiben wir eine Funktion, um mit dem Aufrufen der beiden Schnittstellen umzugehen, und verarbeiten die Daten in einem Format:
function getTickers(url) {
    var ret = []
    try {
        var arr = JSON.parse(HttpQuery(url)).data
        _.each(arr, function(ele) {
            ret.push({
                bid1: parseFloat(ele.bidPx),             // buy one price
                bid1Vol: parseFloat(ele.bidSz),          // volume of buy one price
                ask1: parseFloat(ele.askPx),             // ell one price
                ask1Vol: parseFloat(ele.askSz),          // volume of sell one price
                symbol: formatSymbol(ele.instId)[0],     // in the format of trading pair
                type: "Futures",                         // type
                originalSymbol: ele.instId               // original contract code
            })
        })
    } catch (e) {
        return null
    }
    return ret
}
Schreiben Sie eine weitere Funktion, um den Vertragskode zu verarbeiten.
function formatSymbol(originalSymbol) {
    var arr = originalSymbol.split("-")
    return [arr[0] + "_" + arr[1], arr[0], arr[1]]
}
Als nächstes müssen wir nur die erhaltenen Daten wiederholen und abbilden, die Spreads berechnen und Grafiken graphisieren, um sie zu exportieren, usw.
Hier haben wir den Spread des nächsten Quartalsvertrags 210924 und des Dauervertrags getestet.
Vollständiger Code:
// temporary parameters
var arrSwapContractType = ["BTC-USDT-SWAP", "LTC-USDT-SWAP", "ETH-USDT-SWAP", "ETC-USDT-SWAP"]
var arrDeliveryContractType = ["BTC-USDT-210924", "LTC-USDT-210924", "ETH-USDT-210924", "ETC-USDT-210924"]
var interval = 2000

function createCfg(symbol) {
    var cfg = {
        extension: {
            // it is not part of the group, and is individually displayed; the default is 'group'
            layout: 'single',
            // the specified height, which can be set as string; "300px", which means it will be replaced by "300px" automatically through setting a value of 300
            height: 300,
            // the occupied unit value of the specified width, with a total value of 12
            col: 6
        },
        title: {
            text: symbol
        },
        xAxis: {
            type: 'datetime'
        },
        series: [{
            name: 'plus',
            data: []
        }]
    }

    return cfg
}

function formatSymbol(originalSymbol) {
    var arr = originalSymbol.split("-")
    return [arr[0] + "_" + arr[1], arr[0], arr[1]]
}

function getTickers(url) {
    var ret = []
    try {
        var arr = JSON.parse(HttpQuery(url)).data
        _.each(arr, function(ele) {
            ret.push({
                bid1: parseFloat(ele.bidPx),
                bid1Vol: parseFloat(ele.bidSz),
                ask1: parseFloat(ele.askPx),
                ask1Vol: parseFloat(ele.askSz),
                symbol: formatSymbol(ele.instId)[0],
                type: "Futures",
                originalSymbol: ele.instId
            })
        })
    } catch (e) {
        return null
    }
    return ret
}

function main() {
    // declare arrCfg
    var arrCfg = []
    _.each(arrSwapContractType, function(ct) {
        arrCfg.push(createCfg(formatSymbol(ct)[0]))
    })
    var objCharts = Chart(arrCfg)
    objCharts.reset()

    while (true) {
        // obtain the market quote data
        var deliveryTickers = getTickers("https://www.okex.com/api/v5/market/tickers?instType=FUTURES")
        var swapTickers = getTickers("https://www.okex.com/api/v5/market/tickers?instType=SWAP")
        if (!deliveryTickers || !swapTickers) {
            Sleep(2000)
            continue
        }

        var tbl = {
            type : "table",
            title : "delivery-perpetual spread",
            cols : ["trading pair", "delivery", "perpetual", "positive hedge", "negative hedge"],
            rows : []
        }

        var subscribeDeliveryTickers = []
        var subscribeSwapTickers = []
        _.each(deliveryTickers, function(deliveryTicker) {
            _.each(arrDeliveryContractType, function(symbol) {
                if (deliveryTicker.originalSymbol == symbol) {
                    subscribeDeliveryTickers.push(deliveryTicker)
                }
            })
        })
        _.each(swapTickers, function(swapTicker) {
            _.each(arrSwapContractType, function(symbol) {
                if (swapTicker.originalSymbol == symbol) {
                    subscribeSwapTickers.push(swapTicker)
                }
            })
        })

        var pairs = []
        var ts = new Date().getTime()
        _.each(subscribeDeliveryTickers, function(deliveryTicker) {
            _.each(subscribeSwapTickers, function(swapTicker) {
                if (deliveryTicker.symbol == swapTicker.symbol) {
                    var pair = {symbol: swapTicker.symbol, swapTicker: swapTicker, deliveryTicker: deliveryTicker, plusDiff: deliveryTicker.bid1 - swapTicker.ask1, minusDiff: deliveryTicker.ask1 - swapTicker.bid1}
                    pairs.push(pair)
                    tbl.rows.push([pair.symbol, deliveryTicker.originalSymbol, swapTicker.originalSymbol, pair.plusDiff, pair.minusDiff])
                    for (var i = 0 ; i < arrCfg.length ; i++) {
                        if (arrCfg[i].title.text == pair.symbol) {
                            objCharts.add([i, [ts, pair.plusDiff]])
                        }
                    }
                }
            })
        })

        LogStatus(_D(), "\n`" + JSON.stringify(tbl) + "`")
        Sleep(interval)
    }
}
Bot-Betrieb
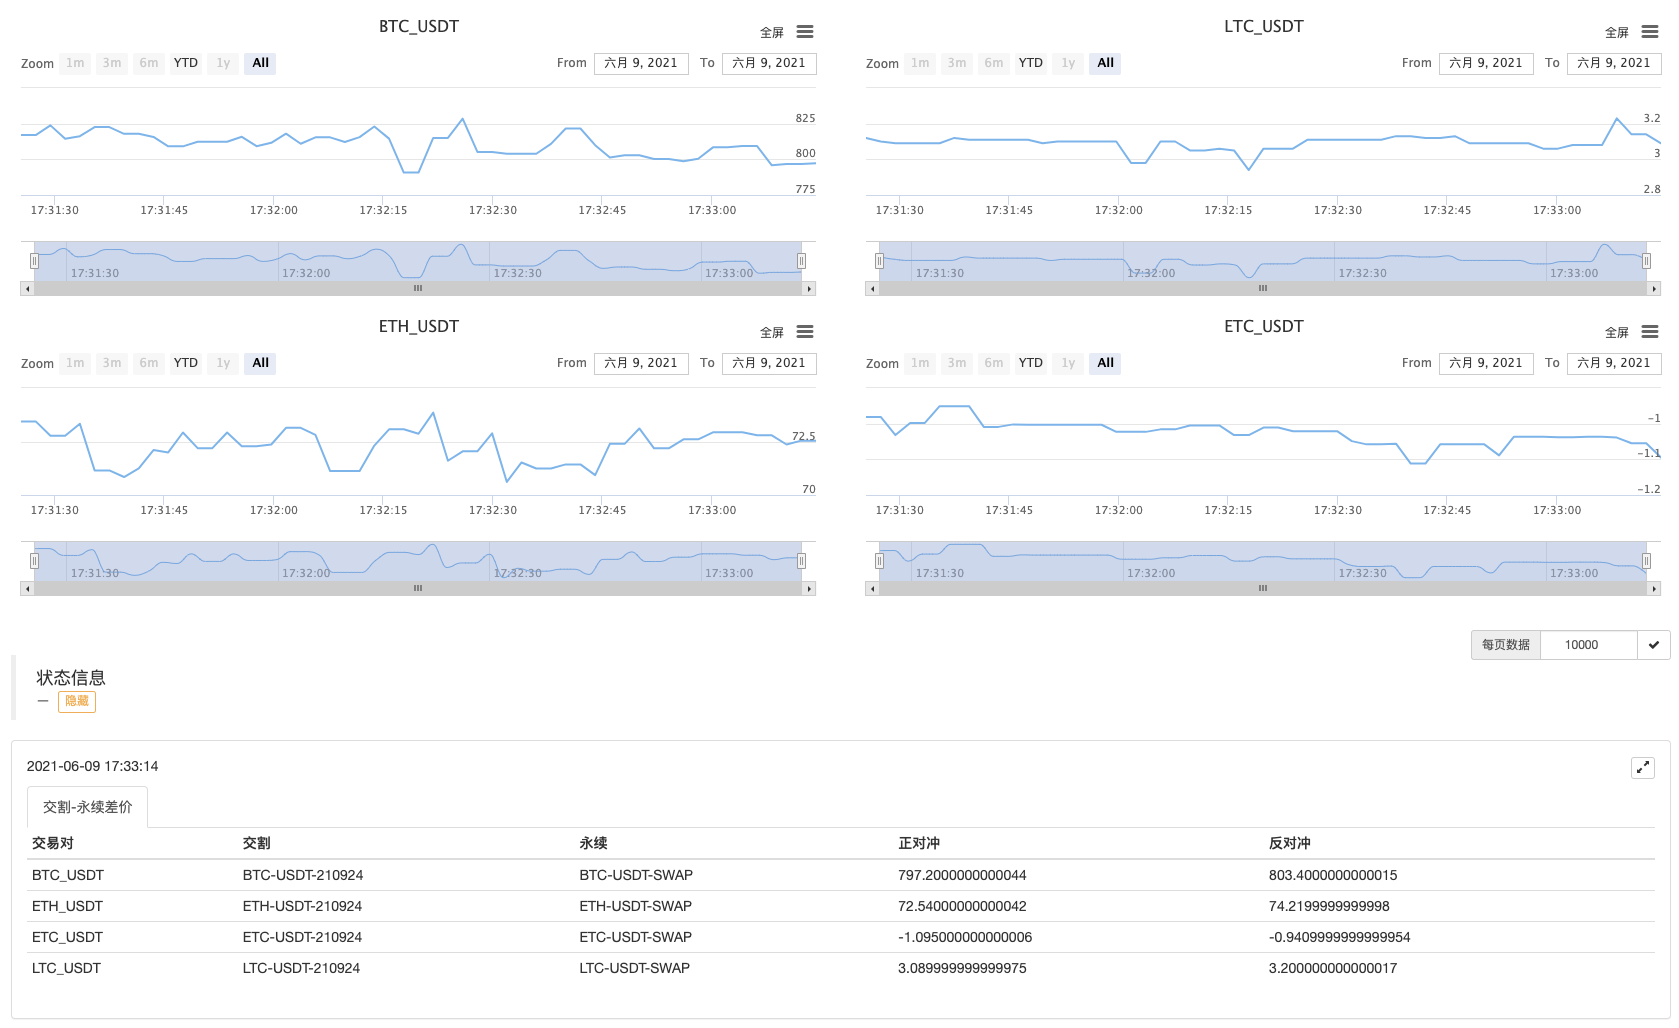
Lauf eine Weile weg.
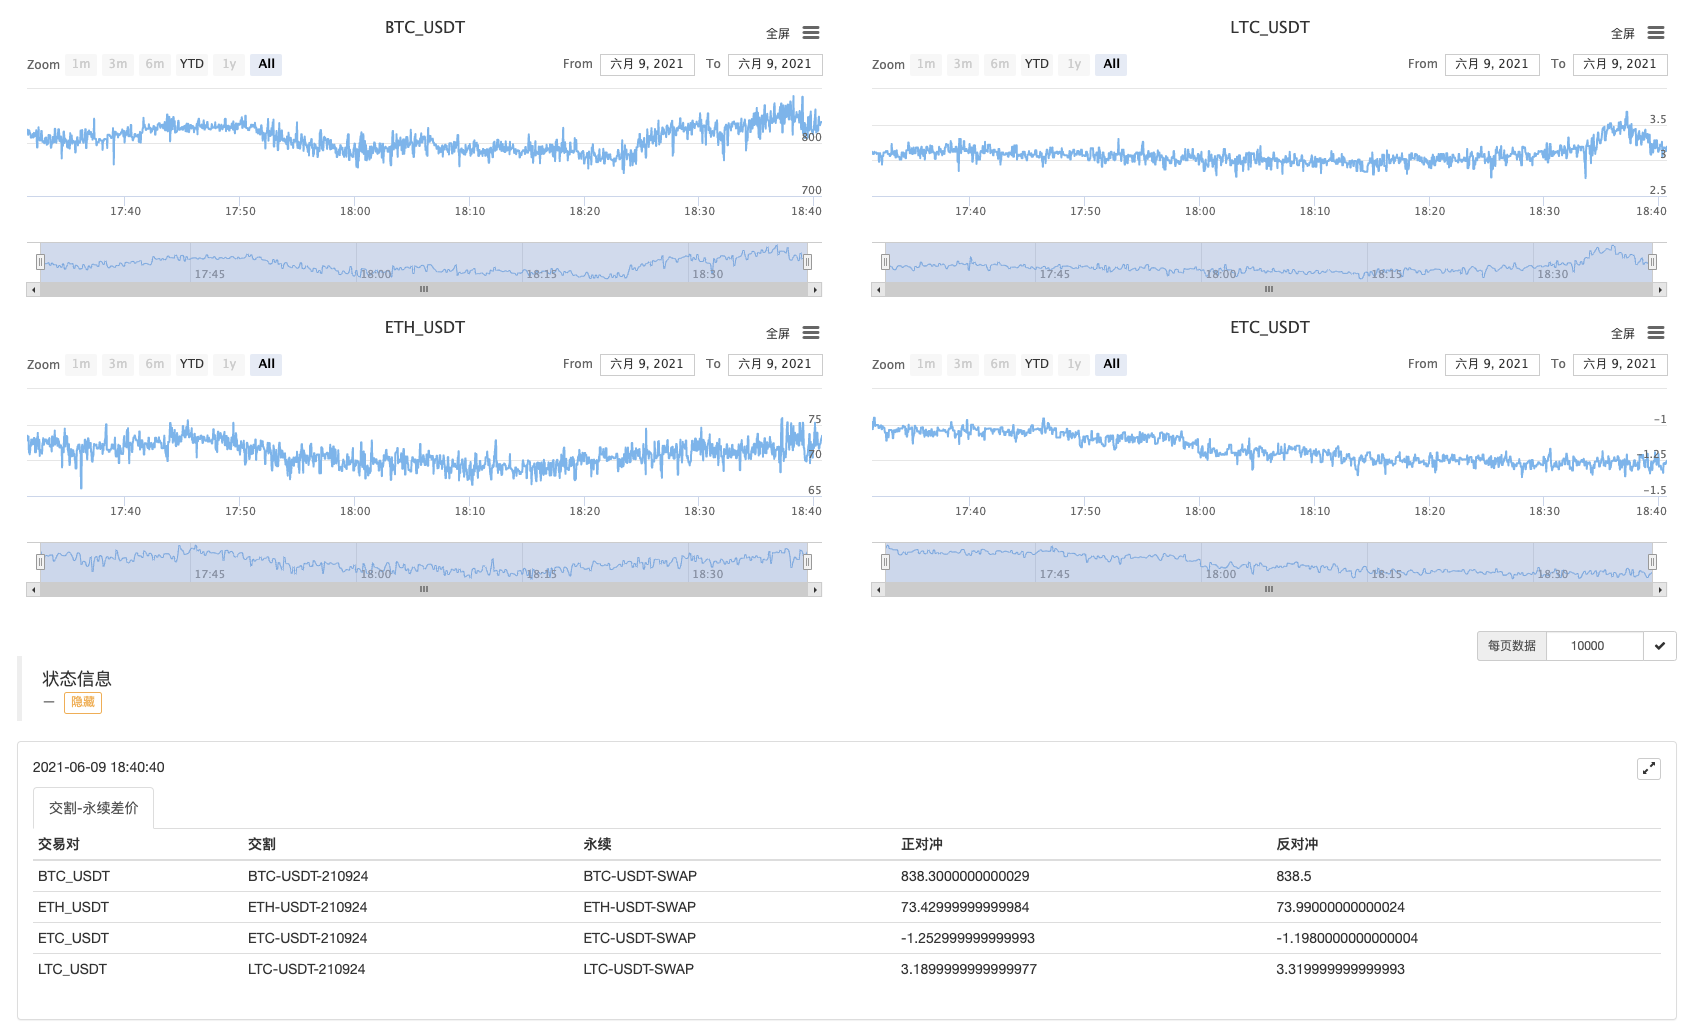
Beobachten Sie zuerst die Ausbreitung!
- Analyse der Strategie des Gewinnsammlers (1)
- Wenn Sie das nicht tun, dann können Sie das nicht tun. Wenn Sie das nicht tun, dann können Sie es nicht tun. Wenn Sie das nicht tun, dann können Sie es nicht tun.
- Hinzufügen von Stoploss zur Risikokontrolle
Was ist der Preis? - Diskussion über Hochfrequenz-Strategie-Design
Magisch modifizierter Profit Harvester - Binance Perpetual Funding Rate Arbitrage (100% des jährlichen Zinssatzes im Bullenmarkt)
- Nutzen Sie die aggregierte Marktoberfläche der Kryptowährungsplattform, um eine Multi-Symbol-Strategie zu erstellen
- Wie schreibt man hier, um ein Signal zu bekommen, wenn man nur einmal druckt und ausführt?
- Derartige Risikopositionen sind nicht zu berücksichtigen.
- Verwenden Sie SQLite zum Erstellen der FMZ Quant-Datenbank
- Anfänger, schauen Sie sich das an
Ich bringe Sie zum Quantitative Trading mit Kryptowährungen (8) - Anfänger, schauen Sie es sich an
Ich bringe Sie zum Quantitative Trading mit Kryptowährungen (6) - Anfänger, schauen Sie sich das an
Ich bringe Sie zum Quantitative Trading mit Kryptowährungen (3) - Anfänger, schau es dir an
Ich bringe dich zum Quantitative Trading mit Kryptowährungen (2) - Meine Erfinder haben die falsche Zeit.
- Ich bin der Meinung, dass es eine gute Idee ist, eine Strategie zu finden, um das zu übersetzen.
- Anfänger, schauen Sie sich das an
Ich bringe Sie zum Quantitative Trading von Kryptowährungen (5) - Anfänger, schauen Sie sich das an
Ich bringe Sie zum Quantitative Trading von Kryptowährungen (4) - Zeit für die Erstellung und Fertigstellung von Bestellungen
- Die Strategie für den Einkauf von Martins Handnetz
- Wenn ihr meine Sprache versteht, könnt ihr mir helfen, den Code zu verstehen, der bedeutet: _TR:=MAX(MAX((HIGH-LOW),ABS(REF(CLOSE,1)-HIGH)),ABS(REF(CLOSE,1)-LOW));