Multi-Indikator-Trendfolgestrategie

Überblick
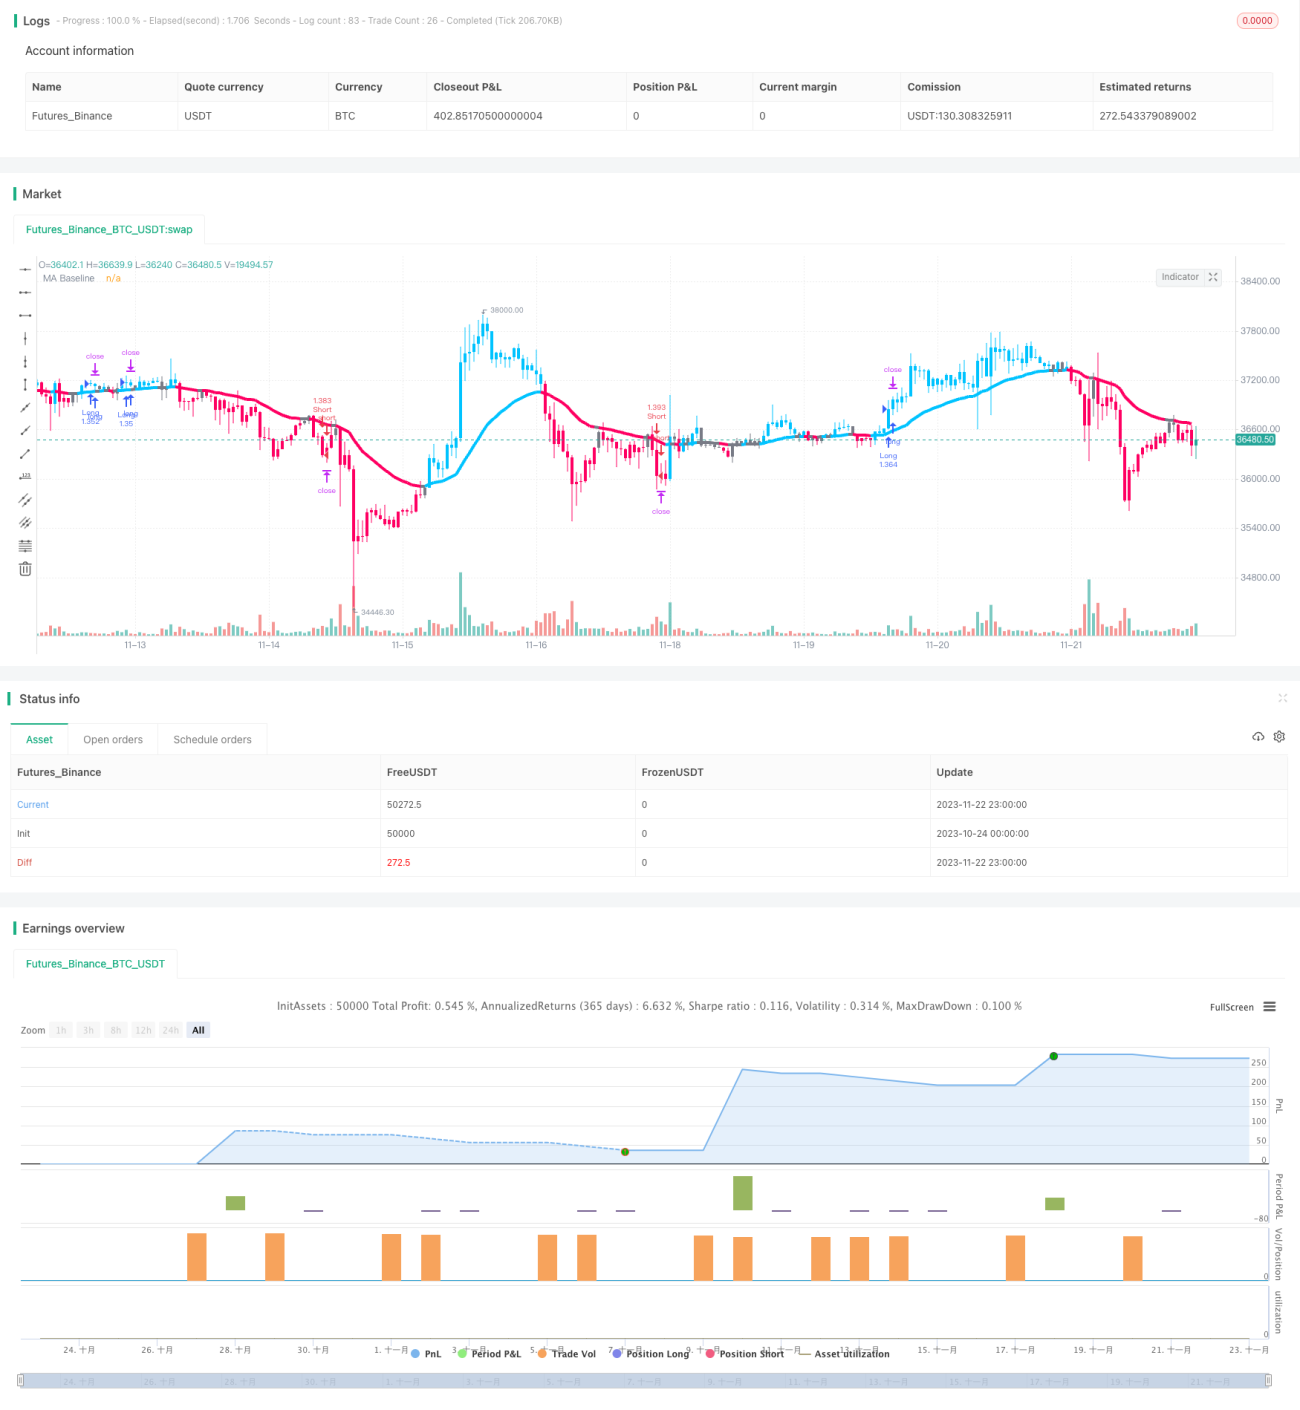
Die Strategie nutzt die AK MACD BB-Anzeige, um die kurzfristige Trendrichtung zu bestimmen, die SSL-Anzeige filtert einige falsche Signale und schließt mit der synthetischen Handelsmenge VSF, um die tatsächliche Kauf- und Verkaufskräfte zu bestimmen und so die richtige Zeit zu bestimmen. Die Strategie setzt die Stop-Loss-Anzeige vor, um die Gewinne zu sperren.
Strategieprinzip
-
AK MACD BB-Indikator
Der Indikator verwendet den Brin-Band auf den MACD-Indikator, der ein Kaufsignal erzeugt, wenn er den Brin-Band durchbricht und ein Verkaufsignal erzeugt, wenn er den Brin-Band durchbricht.
-
SSL-Zahlen
Der SSL-Indikator beurteilt, ob der Preis die Durchschnittslinie überschritten hat, und erkennt das Rücktrittssignal. Wenn der Preis die Durchschnittslinie überschreitet und der SSL-Indikator blau ist, ist dies ein Aufwärtstrend, und wenn der Preis die Durchschnittslinie überschreitet und der SSL-Indikator rot ist, ist dies ein Abwärtstrend.
-
VSF-Indikatoren
Der VSF-Indikator beurteilt die Stärke von Käufern und Verkäufern. Die Strategie sendet nur dann ein Signal aus, wenn die Stärke des Käufers oder des Verkäufers größer als 50% ist, um einen ungültigen Durchbruch zu vermeiden.
-
Schaden-Stopp-Stufen
Die Strategie beinhaltet vier Arten von progressiven Take Profit, die zwischen 1,5 und 3x eingestellt sind. Gleichzeitig wird ein fester Stop-Loss von 2% eingestellt, um den maximalen Verlust eines einzelnen Handels zu kontrollieren.
Analyse der Stärken
-
Mehrindikator-Kombinationen, um genau zu sein
Durch verschiedene Indikatoren, die Trends in mehreren Zeitabschnitten bestimmen, können falsche Signale gefiltert werden, was zu einer genaueren Beurteilung führt.
-
Automatische Stop-Loss, Risiken sind zu kontrollieren
Die Strategie bietet eine eingebaute Stop-Loss-Einstellung, mit der die Verluste eines einzelnen Handels auf etwa 2% begrenzt werden können, um große Verluste zu vermeiden.
-
Die Rückmeldung ist gut.
Laut Publisher Feedback erzielten die profitablen Transaktionen 74% und 427% der Gesamtgewinne aus 100 Transaktionen.
Risiko- und Gegenmaßnahmenanalyse
-
Risiko für starke Marktschwankungen
Bei Schwankungen in den großen Bandbreiten kann es zu mehreren kleinen Verlusten kommen. An dieser Stelle kann die feste Stop-Loss-Werte angepasst oder der Handel ausgesetzt werden.
-
Risiken von mehreren Leerköpfen
Die derzeitige Strategie kann mehr oder weniger tun. Wenn Sie nur mehr oder weniger tun, wird die Chance, keinen Gewinn zu erzielen, um die Hälfte reduziert.
-
Risiken während der Transaktion
Die Strategie nutzt 5-Minuten-Daten, um zu beurteilen, dass die Stichprobenmenge unzureichend ist und die Signale unzuverlässig sein können, wenn es nur ein paar Stunden Daten an einem Handelstag gibt.
Richtung der Strategieoptimierung
-
Optimierung der Stop-Loss-Parameter
Es ist möglich, verschiedene Stop-Loss-Stop-Levels zu testen, um die optimalen Parameter zu finden. Ein zu kleines Stop-Loss kann das Risiko nicht effektiv kontrollieren, ein zu großes Stop-Loss kann mehr Geld verpassen.
-
Hinzufügen einer automatischen Positionsanpassung
Ein Tracking-Stop oder ein Move-Stop können eingestellt werden, um Gewinne zu sichern. Oder erhöhen Sie die Position, um mehr zu gewinnen, je nach bestimmten Bedingungen.
-
In Kombination mit anderen Indikatoren
Es kann eine Kombination verschiedener Indikatoren getestet werden, um zu bestimmen, welche Kombination am besten funktioniert. Es kann auch mehr Indikatoren hinzugefügt werden, um eine Kreuzprüfung durchzuführen.
-
Parameteroptimierung
Die Optimierung der Parameter kann durch Rückprüfungen mit verschiedenen Parametern ermittelt werden. In dieser Strategie kann eine Änderung der Brin-Band-Parameter oder der Mittellinien-Parameter zu besseren Ergebnissen führen.
Zusammenfassen
Die Strategie integriert mehrere Indikatoren, um die Trendrichtung zu bestimmen, setzt automatische Stop-Loss-Systeme ein und ist in der Lage, in starken Trends zu profitieren und einzelne Transaktionsverluste in einem sehr kleinen Bereich zu kontrollieren. Aus den Rückmeldungen der Herausgeber ist die Gewinn- und Gewinnrate sehr ideal. Durch eine gewisse Optimierung wird die Stabilität und Profitabilität der Strategie weiter verbessert werden.
// This source code is subject to the terms of the Mozilla Public License 2.0 at https://mozilla.org/MPL/2.0/
// © myn

//@version=5
strategy('Strategy Myth-Busting #7 - MACDBB+SSL+VSF - [MYN]', max_bars_back=5000, overlay=true, pyramiding=0, initial_capital=1000, currency='USD', default_qty_type=strategy.percent_of_equity, default_qty_value=1.0, commission_value=0.075, use_bar_magnifier = false)


/////////////////////////////////////
//* Put your strategy logic below *//

/////////////////////////////////////
//nwVqTuPe6yo- 1