Bollinger+RSI Dual-Strategie (nur Long) v1.2

1. Strategiebezeichnung
Bollinger + RSI Doppel-Mehrkopf-Strategie
2. Strategieübersicht
Diese Strategie nutzt eine Kombination aus Bollinger-Linie-Indikator und RSI-Indikator, um bei gleichzeitigen Überverkaufssignalen zu überlagern und bei gleichzeitigen Überkaufssignalen zu platzieren. Im Vergleich zu einem einzelnen Indikator ist die Bestätigung des Handelssignals zuverlässiger und verhindert falsche Signale.
Drei, die Strategie
- Überkaufen und Überverkaufen anhand des RSI
- RSI unter 50 ist ein Überverkauf
- RSI über 50 ist ein Überkauf
- Der Einsatz von Brinline zur Bestimmung von Preisanomalien
- Die Preise unterhalb der Unterbahn werden als Überverkauf angesehen.
- Mehr als der Auffahrpreis gilt als Überkauf
- Wenn der RSI und die Bolling-Linie gleichzeitig überverkaufte Signale zeigen, überlagern Sie
- Der RSI liegt unter 50.
- Preislinie unterhalb der Brin-Linienbahn
- Wenn der RSI und die Bolling-Linie gleichzeitig Überkaufsignale zeigen, ist die Position plat.
- Der RSI liegt über 50.
- Die Preiskette ist höher als die von Brin.
Viertens: Strategische Vorteile
- Kombination der beiden Indikatoren, Signal zuverlässiger und vermeidet Falschsignale
- Nur mehrere Positionen, vereinfachte Logik und geringere Risiken
5. Strategische Risiken und Lösungen
- Unzureichende Einstellungen der Brinline-Parameter, zu breite Up-and-Down-Begrenzungen, erhöhtes Risiko für Fehlgeschäfte
- Optimierung der Vorlaufparameter, vernünftige Einstellung der Vorlaufphase und der Standarddifferenz
- Unzureichende Einstellung der RSI-Parameter, unzureichende Kriterien für den Überkauf und Überverkauf, erhöhtes Risiko für Fehltrades
- Optimierung der RSI-Parameter, Anpassung der RSI-Zyklen und vernünftige Einstellung der Überkauf-Überverkauf-Kriterien
- Ravin funktioniert nicht gut, wenn es keine Trends gibt
- In Kombination mit Trendindikatoren, um einen wackligen Trend zu vermeiden
6. Strategische Optimierung
- Optimierung der Brinline- und RSI-Parameter-Einstellungen
- Erhöhung der Stop-Loss-Mechanismen
- Kombination mit Trendindikatoren wie MACD
- Das ist eine sehr wichtige Aufgabe.
VII. Fazit
Diese Strategie kombiniert die Vorteile von Brinline und RSI, die beide gleichzeitig überkaufende und überverkaufende Signale zeigen, und vermeidet die Falschsignale eines einzelnen Indikators, wodurch die Signalgenauigkeit erhöht wird. Im Vergleich zu früheren Versionen werden nur mehrere Positionen eingerichtet, wodurch das Handelsrisiko verringert wird. Die Strategie kann anschließend durch Parameteroptimierung, Stop-Loss-Mechanismen und Kombination mit Trendindikatoren optimiert werden, um sie besser an unterschiedliche Marktbedingungen anzupassen.
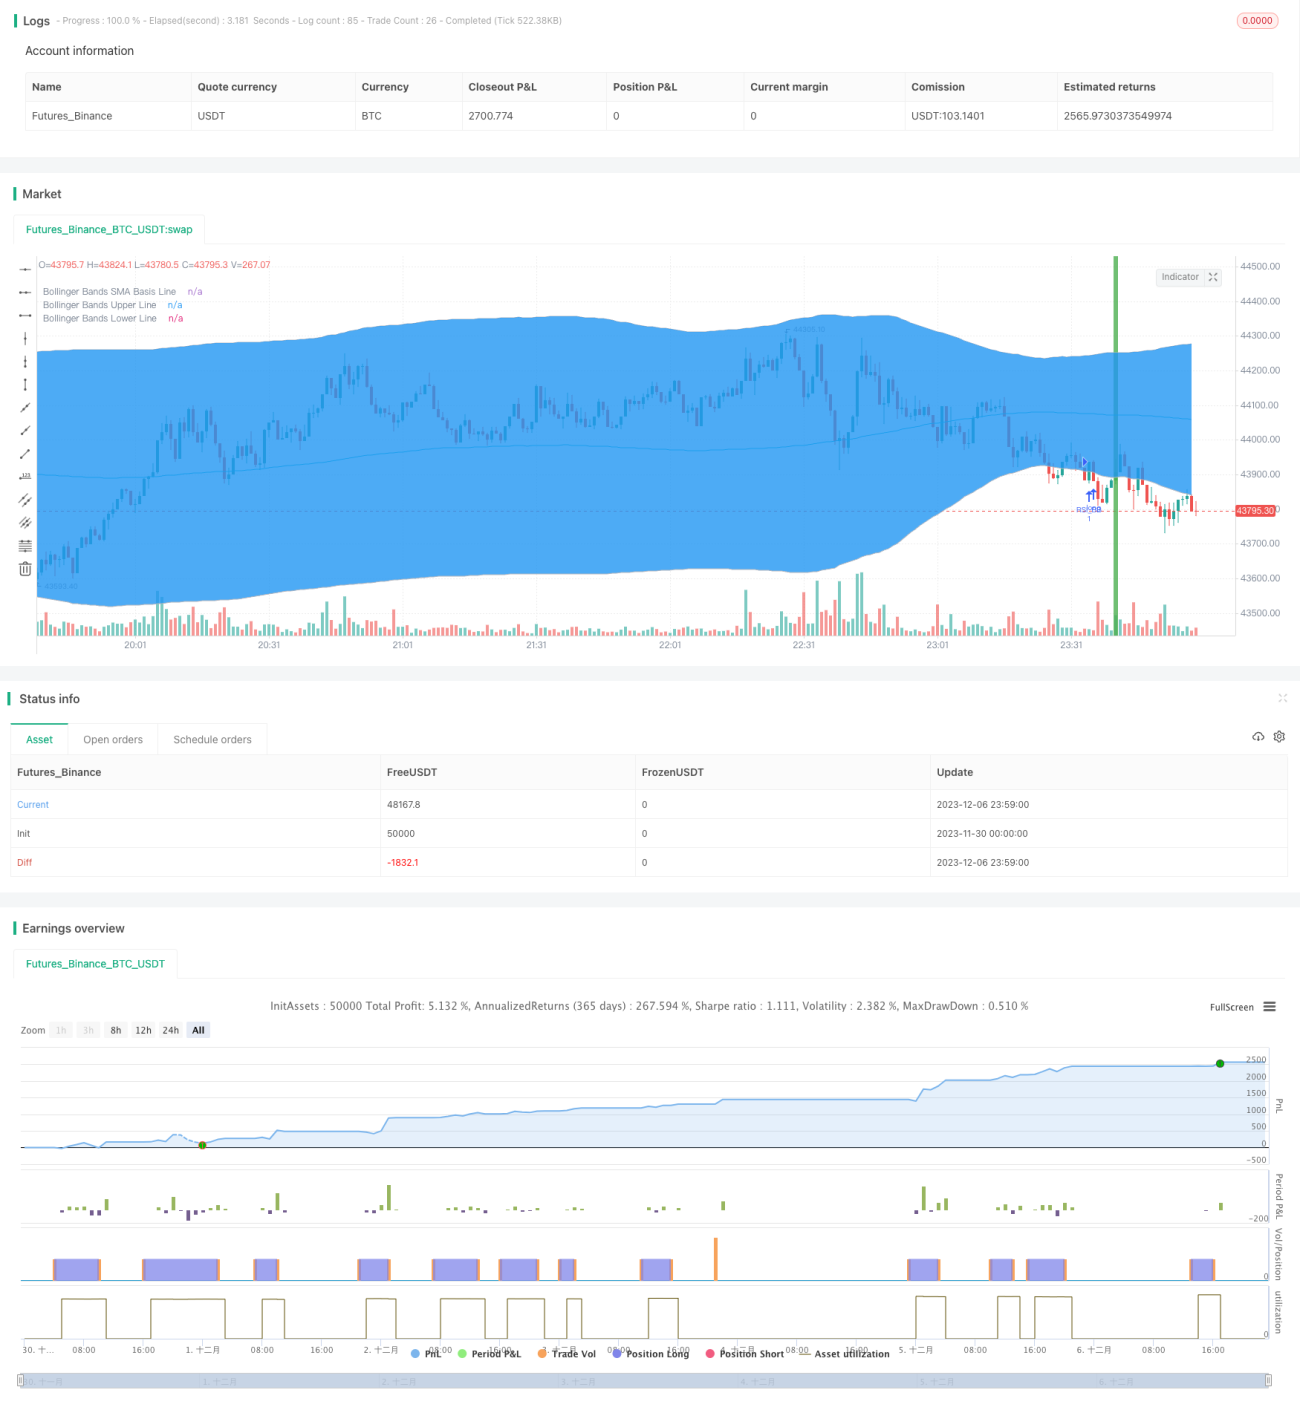
/*backtest
start: 2023-11-30 00:00:00
end: 2023-12-07 00:00:00
period: 1m
basePeriod: 1m
exchanges: [{"eid":"Futures_Binance","currency":"BTC_USDT"}]
*/

//@version=3
strategy("Bollinger + RSI, Double Strategy Long-Only (by ChartArt) v1.2", shorttitle="CA_-_RSI_Bol_Strat_1.2", overlay=true)

// ChartArt's RSI + Bollinger Bands, Double Strategy UPDATE: Long-Only- 1