RSI/MFI Momentum-Indikator-Strategie basierend auf der Dow-Theorie

1
Follow
1779
Followers
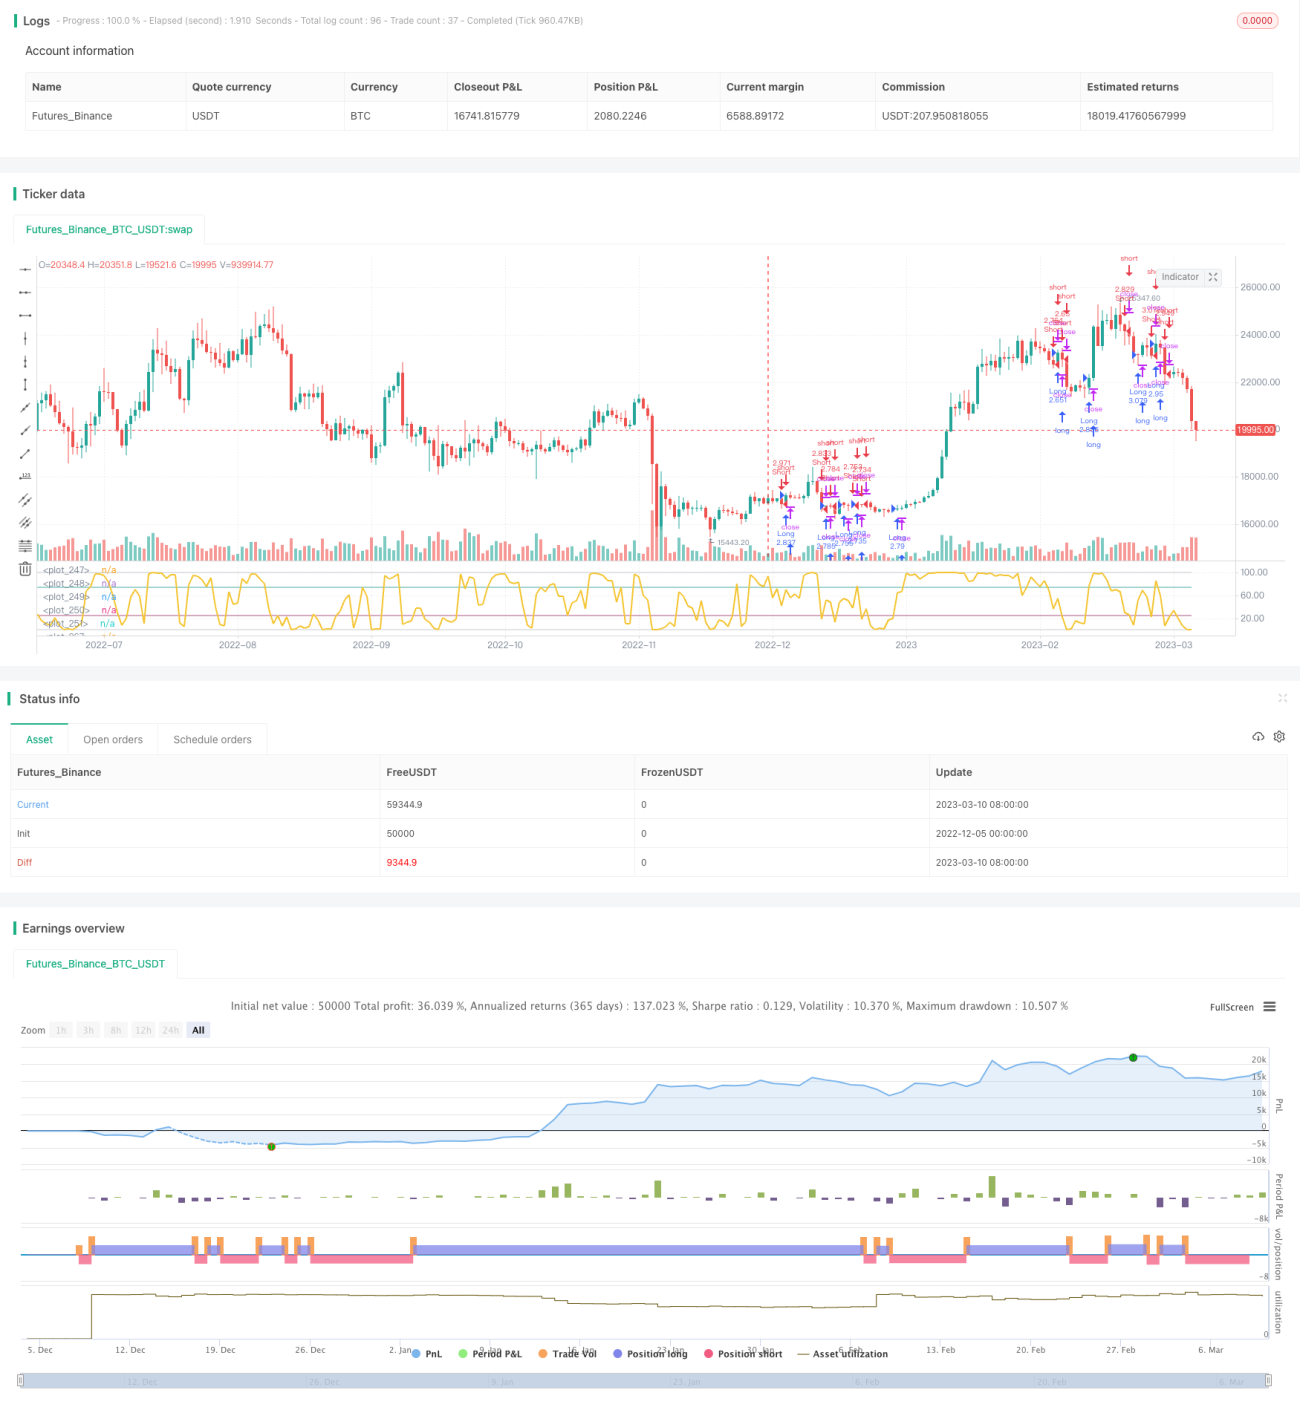
Überblick
Diese Strategie verwendet die relativ starken und schwachen Indikatoren (RSI) oder die Geldflussindikatoren (MFI) für die Entscheidung, ob ein Markt bull oder bear ist, und kombiniert den Bull-Bear-Koeffizienten der Dow-Theorie mit der Berechnung der angepassten Wahrscheinlichkeitsverteilung. Je nach Markttyp werden unterschiedliche Ein- und Ausstiegslogiken verwendet.
Strategieprinzip
- Berechnen Sie den RSI oder MFI, um zu beurteilen, wie der Markt derzeit aussieht (bull oder bear)
- Die Berechnung des Dow-Bear-Koeffizienten, der die Korrelation zwischen aktuellen Preisen und Transaktionsmengen widerspiegelt
- Anpassung der RSI/MFI-Wahrscheinlichkeitsverteilung zur Bestimmung einer genauen Mehrraumverteilung
- Eintritt nach aktueller SessionId und Wahrscheinlichkeit
- Stopp-Loss, wenn die Gewinne zurückgenommen oder der Markt bereinigt wird
Analyse der Stärken
- Mit der Tao-Theorie kann man die Art des Marktes genauer bestimmen
- Einführung von Blindgängern unter Berücksichtigung von Schnittstellen
- Hohe Gewinn- und Verlustquote, niedrige Rücknahme
Risikoanalyse
- Die Parameter sind nicht aktuell und führen zu mehreren Fehleinschätzungen.
- Das ist eine Frage der historischen Daten.
- Die Stop-Loss-Logik ist einfach und kann nicht für spezifische Situationen optimiert werden.
Optimierungsrichtung
- Es gibt mehrere Indikatoren, die in Betracht gezogen werden können, um die Marktveranstaltung zu beurteilen.
- Erweiterte Stop-Loss-Logik basierend auf historischen Daten und Volatilität
- Es gibt viele Möglichkeiten, wie man mit maschinellem Lernen besser Parameter bestimmen kann.
Zusammenfassen
Diese Strategie hat im Allgemeinen gute Rückmeldungsergebnisse und einen gewissen Einsatzwert. Es sind jedoch noch weitere Tests und Anpassungen erforderlich, insbesondere die Stop-Loss-Logik. Die Verwendung von Indikatoren als Hilfsmittel zur Beurteilung ist besser und kann nicht blind gefolgt werden.
Source
Pine
Strategy parameters
Related strategies
Comment
All comments (0)
No data
- 1